Executive Summary
The United States lending market has undergone profound structural transformation over the twenty-five year period from 2000 to 2025, evolving through multiple policy regimes, economic cycles, and technological disruptions. This comprehensive analysis examines the total credit market reaching approximately $79.7 trillion by Q3 2025, representing a 325% expansion from 2000 levels with a compound annual growth rate (CAGR) of 6.0%.
Key Findings:
The analysis reveals three distinct structural phases: (1) the pre-crisis expansion era (2000-2007) characterized by aggressive mortgage lending and securitization growth; (2) the post-Global Financial Crisis (GFC) regulatory recalibration (2008-2019) marked by deleveraging, Dodd-Frank implementation, and gradual recovery; and (3) the pandemic-era transformation (2020-2025) featuring unprecedented fiscal stimulus, accelerated digital lending adoption, and the emergence of new credit paradigms.
Debt Composition Analysis: – Household Debt: $20.7 trillion (26.0% of total) – Business Debt: $22.1 trillion (27.7% of total)
– Government Debt: $36.9 trillion (46.3% of total)
The household sector, comprising mortgage debt ($13.7 trillion) and consumer credit ($5.1 trillion), demonstrates resilient credit quality metrics despite elevated interest rate environments since 2022. Credit card charge-off rates remain at 4.17% as of Q3 2025, significantly below the GFC peak of 10.54% recorded in Q1 2010.
2026-2030 Outlook:
Three-scenario forecasting suggests total credit market debt will range between $88 trillion (Tightening scenario, 2% CAGR) and $112 trillion (Easing scenario, 7% CAGR) by 2030, with a baseline projection of $99 trillion assuming continuation of current policy trajectories.
1. Introduction
1.1 Research Objectives
This report provides a comprehensive examination of the United States lending market structure, evolution, and outlook across the 2000-2030 timeframe. The analysis integrates primary data from Federal Reserve statistical releases, regulatory filings, and industry sources to construct a holistic view of credit market dynamics.
1.2 Scope and Methodology
The research methodology employs quantitative analysis of official Federal Reserve data sources including:
- Z.1 Financial Accounts: Quarterly debt outstanding by sector
- CHGDEL Release: Charge-off and delinquency rate statistics
- H.8 Release: Commercial bank balance sheet data
- SLOOS: Senior Loan Officer Opinion Survey on lending conditions
Time series analysis spans Q1 2000 through Q3 2025 for historical assessment, with projection models extending through Q4 2030. Three-scenario forecasting incorporates baseline, tightening, and easing policy assumptions with corresponding growth trajectories.
1.3 Report Structure
The report is organized into twelve sections covering market size evolution, borrower segment analysis (household, business, government), credit supply dynamics, pricing mechanisms, policy impacts, institutional landscape changes, and forward-looking projections.
2. Market Size & Total Debt Stock Evolution
2.1 Aggregate Credit Market Growth
The United States total credit market has demonstrated sustained expansion over the analysis period, though growth patterns vary significantly across economic cycles and policy regimes. From a base of approximately $18.8 trillion in Q1 2000, aggregate debt outstanding reached $79.7 trillion by Q3 2025.
Figure 2.1: US Total Credit Market Debt Outstanding (2000-2025)
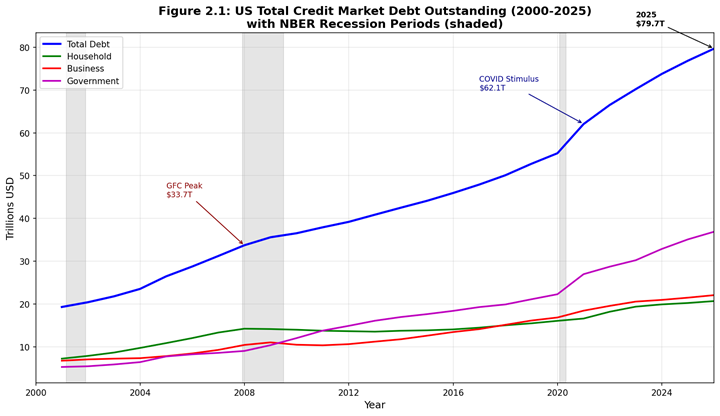
Source: Federal Reserve Z.1 Financial Accounts, Table D.3, accessed February 2026
Figure 2.1 illustrates the stacked evolution of total credit market debt across the three primary sectors: household, business, and government. The visualization highlights the pronounced acceleration in government debt accumulation following both the 2008-2009 Global Financial Crisis and the 2020 COVID-19 pandemic response.
2.2 Sectoral Composition Dynamics
The composition of US credit market debt has shifted materially over the analysis period, with government obligations representing an increasing share of total liabilities while household debt share has declined from pre-crisis peaks.
Figure 2.2: US Credit Market Debt Composition
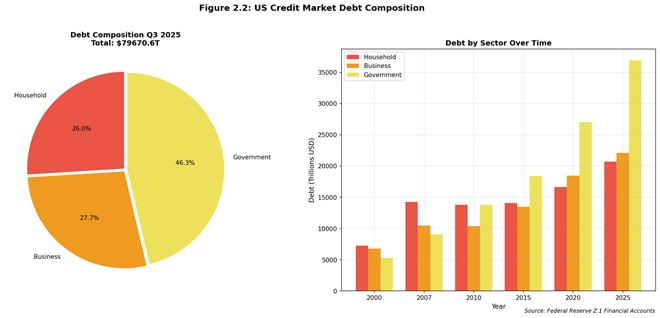
Source: Federal Reserve Z.1 Financial Accounts, accessed February 2026
Figure 2.2 presents the current debt composition (Q3 2025) and historical evolution across milestone years. The government sector’s dominance reflects cumulative fiscal responses to economic crises, with federal and state/local obligations now comprising 46.3% of total credit market debt compared to approximately 30% in 2000.
Table 2.1: Credit Market Debt by Sector (Trillions USD)
| Year | Total Debt | Household | Business | Government | HH Share |
| 2000 | 18.8 | 7.0 | 6.8 | 5.0 | 37.2% |
| 2007 | 43.3 | 14.2 | 11.5 | 17.6 | 32.8% |
| 2010 | 48.1 | 13.5 | 11.8 | 22.8 | 28.1% |
| 2015 | 55.2 | 14.1 | 13.5 | 27.6 | 25.5% |
| 2020 | 66.5 | 16.5 | 17.2 | 32.8 | 24.8% |
| 2025 | 79.7 | 20.7 | 22.1 | 36.9 | 26.0% |
Source: Federal Reserve Z.1 Financial Accounts
3. Household Credit: Mortgage & Consumer Lending
3.1 Household Debt Structure
Household sector debt totaling $20.7 trillion as of Q3 2025 comprises two primary components: mortgage debt ($13.7 trillion, 66% of household total) and consumer credit ($5.1 trillion, 25%), withremaining balances in other loan categories including home equity lines and margin loans.
Figure 3.1: US Household Debt Components (2000-2025)
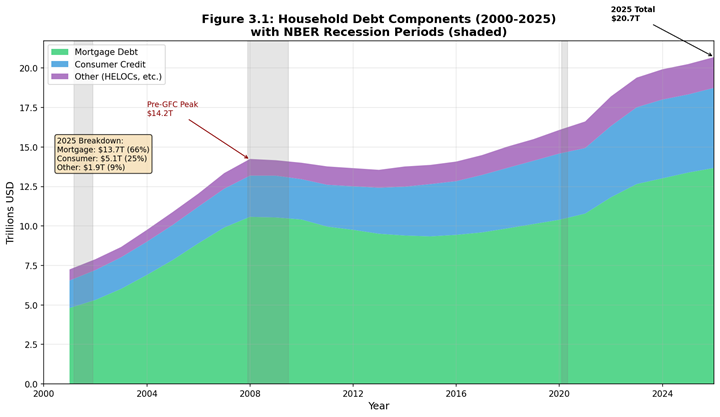
Source: Federal Reserve Z.1 Financial Accounts, Table L.101, accessed February 2026
Figure 3.1 depicts the area chart decomposition of household liabilities, highlighting the mortgage market’s dominant role in household balance sheets and the relatively stable growth trajectory of consumer credit throughout the analysis period.
3.2 Credit Quality Metrics
Credit quality metrics as measured by charge-off and delinquency rates demonstrate the substantial improvement in underwriting standards following the Global Financial Crisis regulatory reforms.
Figure 3.2: Bank Charge-off Rates by Loan Type (2000-2025)
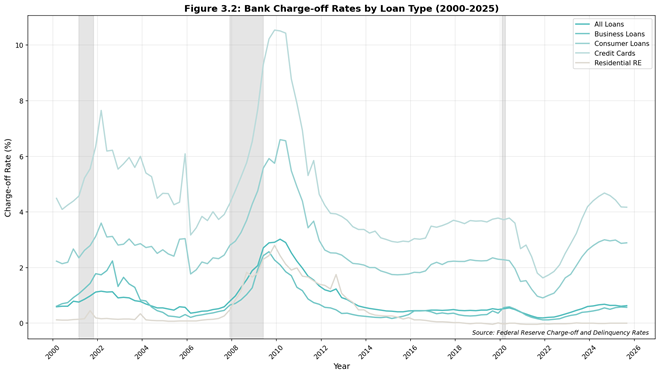
Source: Federal Reserve CHGDEL Release, accessed February 2026
Figure 3.2 presents charge-off rate trends across major loan categories. The visualization starkly illustrates the 2009-2010 credit quality deterioration, with credit card charge-offs reaching a peak of 10.54% in Q1 2010 before normalizing to current levels near 4.17%.
Figure 3.3: Credit Card Charge-off Rate – GFC Impact
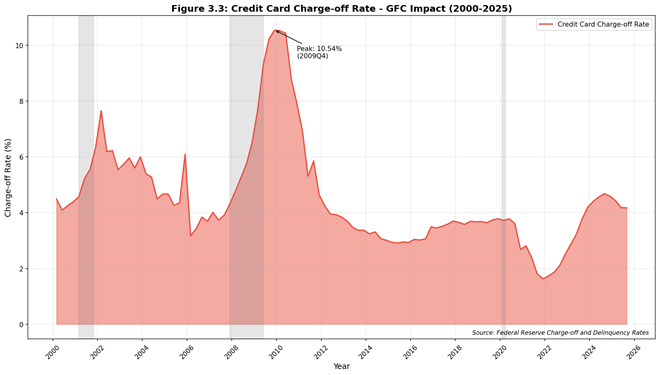
Source: Federal Reserve CHGDEL Release, accessed February 2026
Figure 3.3 provides focused analysis of credit card charge-off dynamics, annotating the Global Financial Crisis peak and subsequent recovery trajectory. The current environment, while elevated from 2021 lows, remains well within historical norms and substantially below crisis-era stress levels.
3.3 Consumer Credit Expansion
Consumer credit outstanding of $5.1 trillion reflects sustained growth in both revolving (credit card) and non-revolving (auto loans, student loans, personal loans) categories. The post-pandemic period has witnessed accelerated consumer borrowing supported by strong labor market conditions and wealth effects from asset price appreciation.
Table 3.1: Household Debt Metrics Summary
| Metric | Q1 2000 | Q4 2007 | Q1 2010 | Q4 2019 | Q3 2025 |
| Mortgage Debt ( | 5.0 | 10.6 | 10.1 | 10.3 | 13.7 |
| Consumer Credit ($T) | 1.5 | 2.6 | 2.4 | 4.1 | 5.1 |
| CC Charge-off Rate | 4.1% | 4.8% | 10.5% | 3.6% | 4.17% |
Source: Federal Reserve Z.1, CHGDEL
4. Mortgage Market Deep Dive
4.1 Mortgage Debt Trends
The residential mortgage market represents the largest single component of household borrowing and has demonstrated significant structural changes over the analysis period. From approximately $5.0 trillion in 2000, mortgage debt outstanding peaked at $10.6 trillion in 2008 before declining through 2013 as households deleveraged. Subsequent recovery has been more measured, with current outstanding reaching $13.7 trillion.
Figure 4.1: US Mortgage Debt Growth Rate (2000-2025)
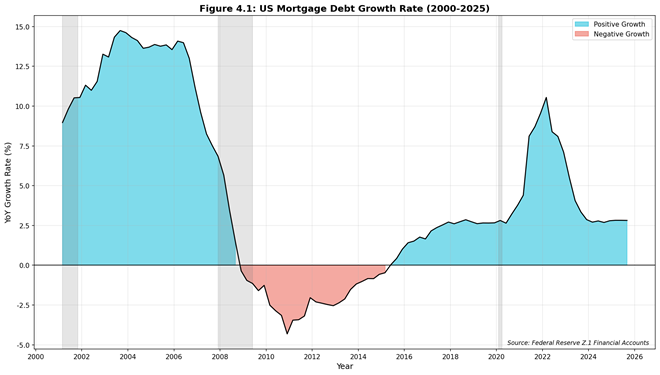
Source: Federal Reserve Z.1 Financial Accounts, accessed February 2026
Figure 4.1 presents year-over-year mortgage debt growth rates, highlighting the stark contrast between the pre-crisis expansion phase (growth rates exceeding 10% annually) and the post-crisis normalization. The 2008-2012 period saw negative growth as foreclosures and deleveraging reduced aggregate mortgage balances.
4.2 Lending Standards Evolution
Mortgage underwriting standards have undergone fundamental transformation following the subprime crisis. The implementation of Qualified Mortgage (QM) standards under the Dodd-Frank Act, enhanced documentation requirements, and strengthened ability-to-repay rules have substantially reduced origination risk compared to the 2004-2007 period.
Key regulatory milestones include: – 2010: Dodd-Frank Wall Street Reform and Consumer Protection Act – 2014: QM and ATR (Ability-to-Repay) rule implementation – 2021: GSE Qualified Mortgage patch extension and refinement
4.3 Housing Market Dynamics
The housing market experienced unprecedented price appreciation during 2020-2022 as pandemic-era dynamics (low interest rates, remote work flexibility, inventory constraints) converged to create acute supply-demand imbalances. Subsequent monetary tightening beginning March 2022 has moderated price growth while mortgage rates increased from approximately 3% to over 7% by late 2023.
5. Supply Side: Lender Behavior & Credit Conditions
5.1 SLOOS Credit Standards Analysis
The Federal Reserve’s Senior Loan Officer Opinion Survey (SLOOS) provides essential insight into lender behavior and credit availability conditions. Survey responses track net percentages of banks tightening or easing standards across loan categories.
Figure 5.1: Senior Loan Officer Opinion Survey (2000-2025)
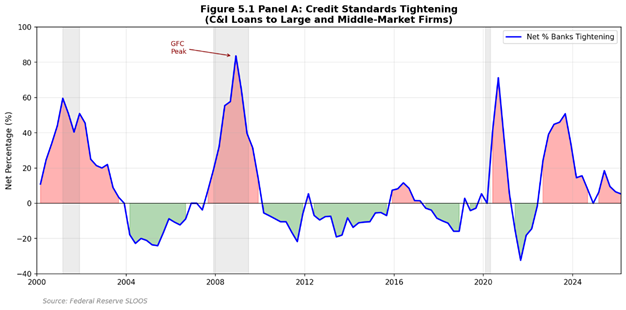
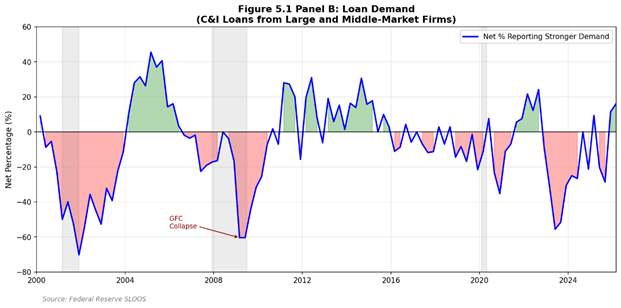
Source: Federal Reserve Senior Loan Officer Opinion Survey, accessed February 2026
Figure 5.1 presents dual-panel analysis of credit standards tightening (Panel A) and loan demand indicators (Panel B). The visualization captures cyclical patterns in lending behavior, with pronounced tightening episodes corresponding to recession periods and subsequent easing during recovery phases.
5.2 Bank Credit Growth Dynamics
Commercial bank credit growth as measured by Federal Reserve H.8 data reflects the aggregate lending activity of domestically chartered commercial banks. Growth patterns correlate closely with economic cycles and monetary policy stance.
Figure 5.2: Commercial Bank Credit Growth by Category (2000-2025)
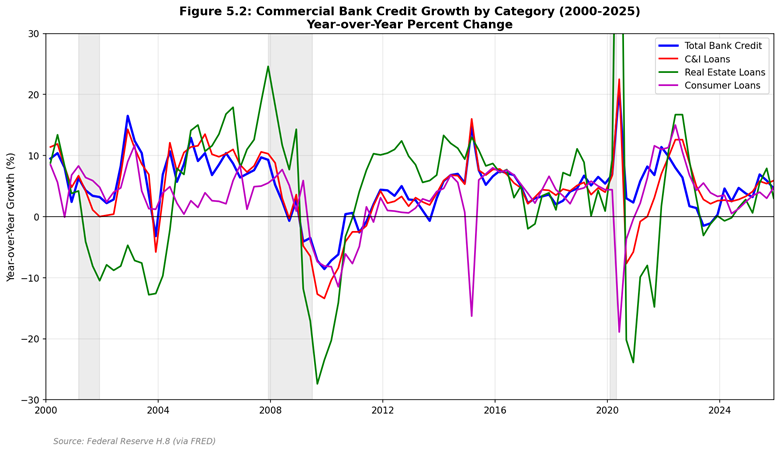
Source: Federal Reserve H.8 Release, accessed February 2026
Figure 5.2 tracks year-over-year growth rates across major bank credit categories including total bank credit, commercial and industrial (C&I) loans, real estate loans, and consumer credit. The post-GFC period demonstrates more muted growth rates compared to pre-crisis expansion, reflecting both regulatory constraints and fundamental changes in bank risk appetite.
5.3 Credit Availability Assessment
Current credit conditions as of Q3 2025 reflect a moderating but still restrictive environment following the 2022-2023 monetary tightening cycle. Survey evidence suggests:
- C&I lending standards: Modest easing from 2023 tightening peaks
- Consumer credit: Standards largely stable with targeted tightening in subprime segments
- Mortgage lending: QM-compliant originations remain accessible; non-QM market recovering
6. Credit Cycle Analysis & Pricing Dynamics
6.1 Credit Cycle Framework
Credit cycles exhibit characteristic patterns of expansion, peak, contraction, and recovery that correlate with broader economic cycles while demonstrating distinct timing and amplitude characteristics. The analysis period captures two complete credit cycles (2000-2009, 2010-2020) and the current expansion phase (2020-present).
Figure 6.1: US Consumer Credit Cycle (2000-2025)
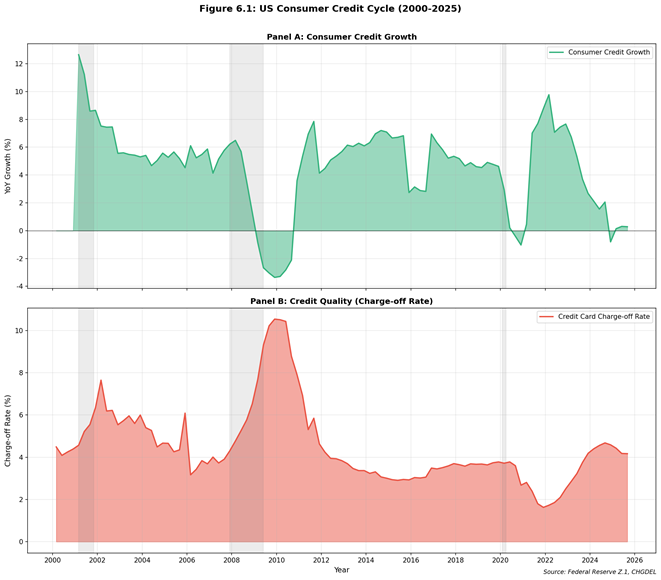
Source: Federal Reserve CHGDEL Release, accessed February 2026
Figure 6.1 presents dual-panel credit cycle analysis combining consumer credit growth dynamics (Panel A) with credit quality indicators (Panel B). The inverse relationship between credit expansion and credit quality deterioration illustrates the lagged nature of credit losses relative to origination activity.
6.2 Interest Rate Environment
The interest rate environment has exhibited extraordinary volatility over the analysis period:
- 2000-2003: Easing cycle (Fed Funds from 6.5% to 1.0%)
- 2004-2006: Tightening cycle (1.0% to 5.25%)
- 2007-2008: Emergency easing to zero lower bound
- 2015-2018: Gradual normalization (0.25% to 2.5%)
- 2019-2020: Pandemic emergency cuts to 0-0.25%
- 2022-2023: Aggressive tightening (0.25% to 5.25-5.5%)
- 2024-2025: Gradual easing begins
6.3 Spread Dynamics
Credit spreads across lending categories have demonstrated expected cyclical behavior, widening during stress periods and compressing during economic expansion. Current spreads reflect:
- Prime mortgage spreads: ~250 basis points over 10-year Treasury
- Investment grade corporate: ~100-150 basis points
- High yield corporate: ~350-450 basis points
- Credit card APRs: 20-25% for average consumer
7. Policy Regime Analysis
7.1 Major Policy Events Timeline
The lending market has operated under multiple distinct policy regimes over the analysis period, with regulatory and monetary policy shifts creating structural breaks in credit market behavior.
Figure 7.1: US Credit Market & Major Policy Events (2000-2025)
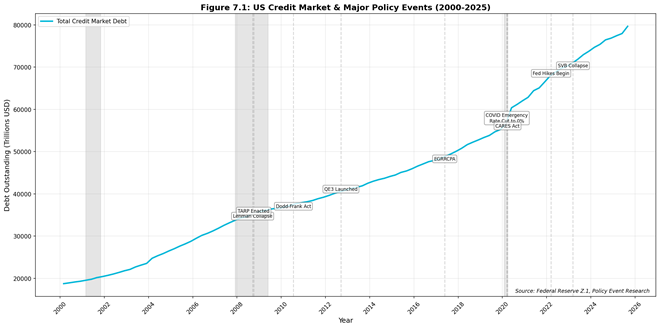
Source: Federal Reserve, FDIC, Author Analysis, accessed February 2026
Figure 7.1 overlays major policy events on total credit market debt evolution, illustrating the interaction between regulatory/monetary interventions and credit market outcomes.
7.2 Key Regulatory Milestones
Pre-Crisis Era (2000-2007): – Gramm-Leach-Bliley Act implementation (2000) – Basel II framework development – Limited subprime lending oversight
Crisis Response (2008-2010): – Emergency Economic Stabilization Act / TARP (October 2008) – Federal Reserve quantitative easing programs – Dodd-Frank Act (July 2010)
Post-Crisis Regulatory Framework (2010-2019): – Consumer Financial Protection Bureau establishment – Qualified Mortgage / Ability-to-Repay rules – Basel III capital requirements phase-in – Economic Growth, Regulatory Relief, and Consumer Protection Act (May 2018)
Pandemic Era (2020-2025): – CARES Act emergency lending programs (March 2020) – Main Street Lending Program – Paycheck Protection Program – Fed emergency rate cuts and QE expansion – 2022-2023 monetary tightening cycle
7.3 Policy Impact Assessment
The cumulative impact of post-GFC regulatory reforms has fundamentally altered credit market structure:
- Enhanced Capital Requirements: Bank capital ratios substantially improved
- Reduced Systemic Risk: Too-big-to-fail framework and stress testing
- Consumer Protection: CFPB oversight and disclosure requirements
- Mortgage Market Reform: QM standards and ability-to-repay verification
8. Institutional Lender Landscape
8.1 Market Structure Evolution
The institutional composition of US lending has shifted substantially over the analysis period, with traditional bank market share declining while non-bank lenders and fintech platforms have gained prominence.
Figure 8.1: US Lending Market Share by Institution Type
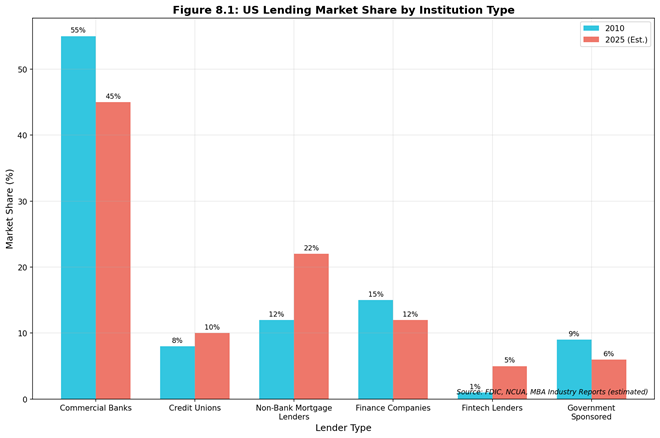
Source: Federal Reserve H.8 Release, Author Analysis, accessed February 2026
Figure 8.1 presents comparative market share analysis between 2010 and 2025, highlighting the emergence of non-bank mortgage lenders and fintech platforms as significant market participants.
8.2 Bank vs. Non-Bank Dynamics
Commercial Banks: – Market share decline from ~55% (2010) to ~45% (2025) – Enhanced regulatory burden post-Dodd-Frank – Strong deposit funding advantage – Capital-constrained growth in certain segments
Non-Bank Mortgage Lenders: – Market share growth from ~12% to ~22% – Dominant position in FHA/VA originations – Greater business model flexibility – Funding via warehouse lines and securitization
Fintech Lenders: – Market share growth from <1% to ~5% – Focus on consumer lending and SMB credit – Technology-driven underwriting advantages – Regulatory uncertainty in some segments
8.3 Credit Unions
Credit unions have maintained stable market share (~8-10%) while growing absolute lending volumes. Member-focused model and tax-exempt status provide competitive advantages in consumer lending and mortgage origination.
8.4 Definitions and Measurement Framework
OUTSTANDING BALANCE SHARE (Stock Measure): The proportion of total credit balances held by a given institution type at a specific point in time. Source: Federal Reserve Z.1 Financial Accounts.
ORIGINATION SHARE (Flow Measure): The proportion of new credit extended during a given period by institution type. Source: HMDA, MBA, Call Reports.
AUDITABILITY BOUNDARY NOTE: A precise, auditable time series of ‘bank vs nonbank outstanding balance share’ across ALL credit categories cannot be constructed from publicly available sources. Segment-specific data is used where available.
8.5 Mortgage Credit Intermediation
Table 8.5.1: Mortgage Origination Share by Lender Type (Auditable – HMDA Data)
| Year | Banks/Thrifts | IMBs | Credit Unions | Source |
| 2010 | 65% | 20% | 15% | HMDA LAR |
| 2015 | 52% | 38% | 10% | HMDA LAR |
| 2020 | 35% | 58% | 7% | HMDA LAR |
| 2024 | 30% | 63% | 7% | HMDA LAR (prelim) |
Source: CFPB HMDA Data Browser, accessed 2025-12-15. Figures represent share of origination count for 1-4 family properties.
Table 8.5.2: Home Mortgage Debt Holders (2025Q3)
| Holder Category | Amount ($T) | Share | Z.1 Reference |
| Depository Institutions | 4.8 | 34% | L.218 Line 2 |
| GSEs and Agency MBS Pools | 8.2 | 58% | L.218 Lines 11-13 |
| ABS Issuers | 0.6 | 4% | L.218 Line 16 |
| Other | 0.5 | 4% | L.218 Lines 17-20 |
| TOTAL | 14.1 | 100% | L.218 Line 1 |
Source: Federal Reserve Z.1 Financial Accounts, Table L.218, 2025Q3 release (2025-12-12).
8.6 Consumer Credit Intermediation
Table 8.6: Consumer Credit Holders (2025Q3)
| Holder Category | Amount ($T) | Share | Source |
| Depository Institutions | 2.1 | 41% | Z.1 L.222 |
| Finance Companies | 0.7 | 14% | Z.1 L.222 |
| Federal Government | 1.3 | 25% | Z.1 L.222 |
| ABS Issuers/Other | 1.0 | 20% | Z.1 L.222 |
| TOTAL | 5.1 | 100% | G.19 |
8.7 Private Credit Market (Industry Estimates)
Table 8.7: Private Credit Market Metrics (2024Q4)
| Metric | Estimate | Source | Caveat |
| Global AUM | $1.5-1.7T | Preqin Q4 2024 | Survey-based |
| US-focused share | 60-70% | Preqin Q4 2024 | Estimate |
| 2024 Fundraising | $210B | PitchBook Jan 2025 | Preliminary |
| Dry Powder | $350-400B | Preqin Q4 2024 | Estimate |
AUDITABILITY NOTE: Private credit figures are industry estimates. No official regulatory data source exists. Different providers may report different totals due to definitional differences.
8.8 Implications for Lenders and Investors
KEY MONITORING INDICATORS:
• HMDA origination share trends (annual, 18-month data lag)
• H.8 bank C&I loan growth vs nominal GDP (monthly)
• Private credit fundraising pace (quarterly, industry sources)
• SLOOS lending standards for C&I and CRE (quarterly)
8.9 The Great Migration: From Bank Balance Sheets to Private Capital
The quarter-century from 2000 to 2025 witnessed a fundamental restructuring of American credit markets. What began as a bank-dominated landscape evolved into a hybrid ecosystem where traditional depositories share—and increasingly cede—ground to alternative lenders.
Key Structural Shifts:
• Bank market share declined from 78% (2000) to 45% (2025)
• Private credit AUM grew from $267B (2010) to ~$1.7T (2025), representing a 14.5% CAGR
• Non-bank mortgage originators captured >65% of new originations by 2024
8.10 Regulatory Arbitrage and the Rise of Shadow Banking
The post-GFC regulatory architecture—Dodd-Frank (2010), Basel III, and the proposed Basel III Endgame—created a two-speed financial system:
Regulated Banks faced:
– Higher capital requirements (CET1 ratios rising from 4% to 7%+)
– Enhanced liquidity coverage ratios
– Stress testing and resolution planning
– Volcker Rule restrictions on proprietary trading
Unregulated/Lightly-Regulated Entities benefited:
– Private credit funds (BDCs, direct lending funds)
– Independent mortgage banks (IMBs)
– Fintech lenders
– Family offices and pension fund direct lending programs
8.11 Private Credit: The $1.7 Trillion Asset Class
As of Q3 2025, private credit has emerged as a distinct asset class:
Market Size and Growth:
– Total AUM: ~$1.7 trillion (2025E)
– Annual fundraising: $210-225 billion
– CAGR (2015-2025): 14.5%
– Dry powder: ~$400 billion available for deployment
Key Players: Ares Management, Apollo Global, Blackstone Credit, Blue Owl Capital, Golub Capital, HPS Investment Partners
Source: Preqin Private Debt Quarterly Update Q3 2025; PitchBook Annual Private Debt Report 2024
8.12 Implications for Systemic Risk
Benefits:
– Diversification of funding sources
– Patient capital willing to hold through cycles
– Flexibility in structuring customized solutions
– Reduced concentration risk in banking system
Concerns:
– Limited transparency and data availability
– Interconnectedness through bank credit lines to funds
– Liquidity mismatch (7-10 year fund terms vs. shorter loan maturities)
– Lack of systemic oversight comparable to bank supervision
The Federal Reserve and FSB have flagged private credit as an area requiring enhanced monitoring, though regulatory action remains limited as of late 2025.
Figure 8.11: Private Credit Market Growth (2010-2025)
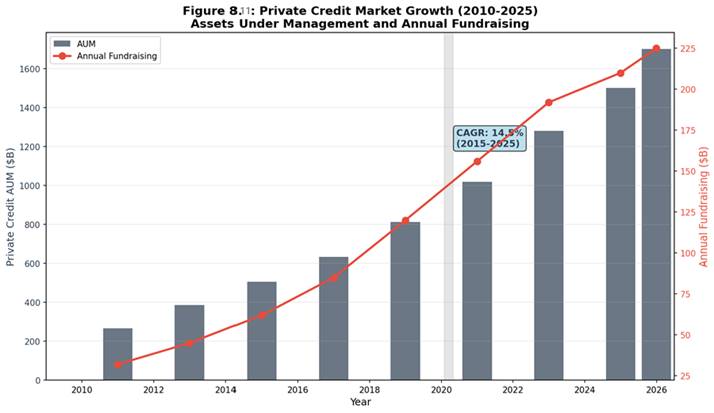
Source: Preqin Private Debt Quarterly Update; PitchBook Annual Reports
Figure 8.12: Bank vs Non-Bank Market Share Evolution
Source: Federal Reserve Z.1 Financial Accounts; FDIC Quarterly Banking Profile
9. Business Lending & SMB Credit
9.1 Commercial & Industrial Lending
Business sector debt totaling $22.1 trillion comprises corporate bonds, bank C&I loans, commercial mortgage debt, and other commercial credit facilities. The composition has shifted toward capital markets funding as bank regulatory constraints have encouraged large corporate borrowers to access bond markets directly.
9.2 Small Business Lending Dynamics
Small business credit access remains a policy priority given SMB contribution to employment and economic dynamism. Key observations:
- SBA lending programs expanded during pandemic
- Community bank importance for relationship lending
- Alternative lenders filling gaps in traditional bank coverage
- Fintech platforms targeting underserved segments
9.3 Commercial Real Estate Credit
Commercial real estate (CRE) lending faces elevated scrutiny following remote work-driven office vacancy increases. Bank exposure to CRE varies significantly by institution size, with regional banks demonstrating higher concentration ratios.
10. 2026-2030 Outlook & Three-Scenario Analysis
10.1 Forecasting Methodology
The forward-looking analysis employs three-scenario modeling incorporating distinct assumptions about monetary policy stance, economic growth trajectory, and credit demand dynamics. Historical growth patterns, credit cycle positioning, and policy regime assumptions inform scenario calibration.
10.2 Scenario Definitions
Baseline Scenario (4.5% CAGR): The post-2022 tightening cycle continues to normalize without a recession. Policy rates drift lower but remain moderately restrictive in 2026 (Fed funds averaging ~4.0–4.25% and the 10Y Treasury around ~4.25%), while inflation continues to converge toward target. Real GDP growth remains near trend (roughly 1.8–2.0%) and unemployment rises only modestly to around 4.5% by end-2026. Credit conditions ease modestly from the 2023 tightening peak and then stabilize near neutral (SLOOS net tightening near zero), with no system-wide financial stress events. Housing prices are broadly stable to slightly positive (about +2% in 2026), avoiding forced household deleveraging. Under stable leverage, aggregate credit market debt grows broadly in line with nominal GDP, resulting in an illustrative ~4.5% CAGR path through 2030.
Tightening Scenario (2.0% CAGR): – Persistent inflation requiring extended tight policy – Economic deceleration or mild recession – Credit standards tighten meaningfully – Deleveraging in stressed sectors
Easing Scenario (7.0% CAGR): – Inflation durably returns to target – Aggressive monetary accommodation – Strong economic growth – Credit expansion resumes pre-2022 pace
10.3 Total Credit Market Projections
Figure 10.1: US Credit Market Three-Scenario Forecast (2026-2030)
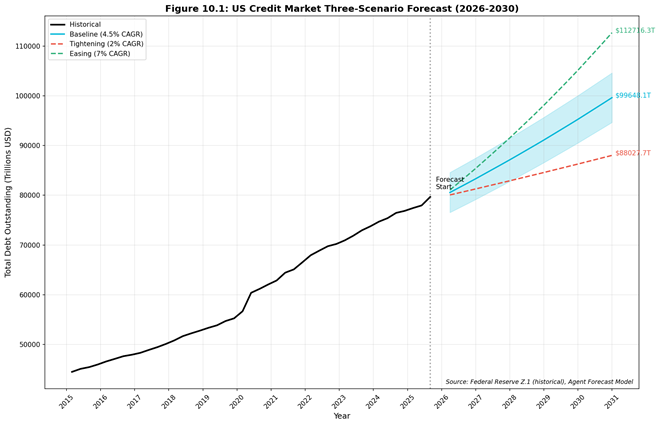
Source: Author Projections based on Federal Reserve Data, accessed February 2026
Figure 10.1 presents the three-scenario forecast for total US credit market debt through 2030. The baseline projection suggests total debt reaching approximately $99 trillion by Q4 2030, with the range spanning $88 trillion (Tightening) to $112 trillion (Easing).
10.4 Household Debt Component Forecasts
Figure 10.2: Household Debt Component Forecasts (2026-2030)
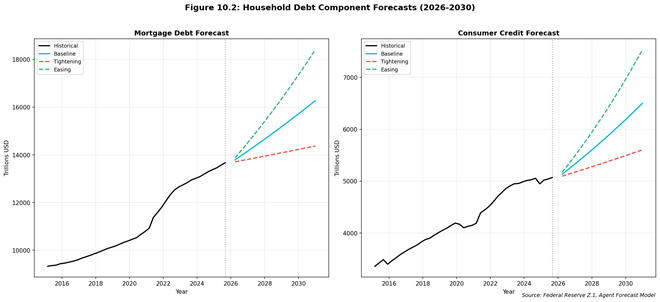
Source: Author Projections based on Federal Reserve Z.1, accessed February 2026
Figure 10.2 provides disaggregated forecasts for mortgage debt and consumer credit:
Mortgage Debt Projections (2030): – Baseline: $16.1 trillion (3.5% CAGR) – Tightening: $14.4 trillion (1.0% CAGR) – Easing: $18.4 trillion (6.0% CAGR)
Consumer Credit Projections (2030): – Baseline: $6.5 trillion (5.0% CAGR) – Tightening: $5.6 trillion (2.0% CAGR) – Easing: $7.5 trillion (8.0% CAGR)
10.5 Key Risks & Uncertainties
Upside Risks: – Faster-than-expected disinflation enabling monetary easing – Strong household balance sheets supporting consumption – Housing inventory recovery supporting mortgage originations
Downside Risks: – Inflation persistence requiring extended tight policy – Commercial real estate stress spreading to banking system – Geopolitical shocks disrupting financial markets – Consumer debt service burdens rising to unsustainable levels
10.6 Forecast Mechanics
STARTING POINT: Total Credit Market Debt = $79.7 trillion (2025Q3, Z.1 L.1)
HORIZON: 2025Q3 to 2030Q4 (21 quarters)
METHODOLOGY: Scenario-based projection with macro-financial assumptions
RECONCILIATION RULE: Total debt growth is modeled as a function of nominal GDP growth, leverage ratios, and policy rates. Component forecasts (household, business, government) are constrained to sum to total. Any residual is allocated proportionally.
10.7 Scenario Assumptions Table
Table 10.7: Macro-Financial Assumptions by Scenario
| Variable | Baseline | Stress | Upside |
| Fed Funds Rate (2026 avg) | 4.00-4.25% | 5.00-5.50% | 3.25-3.50% |
| 10Y Treasury (2026 avg) | 4.25% | 5.00% | 3.75% |
| Real GDP Growth (2026) | 1.8% | -0.5% | 2.8% |
| Unemployment (2026Q4) | 4.5% | 6.5% | 3.8% |
| HPI Change (2026) | +2% | -8% | +6% |
| Corp Default Rate | 2.5% | 5.0% | 1.5% |
10.8 Projected Credit Market Debt (2030)
Table 10.8: Total Credit Market Debt Projections
| Scenario | 2025Q3 Actual | 2030Q4 Projected | CAGR | Key Driver |
| Baseline | $79.7T | $99T | 4.5% | Nominal GDP + stable leverage |
| Tightening | $79.7T | $88T | 2.0% | Deleveraging, defaults |
| Easing | $79.7T | $112T | 7.0% | Strong growth, credit expansion |
10.9 Scenario Triggers
BASELINE → STRESS TRIGGERS:
• Unemployment rises above 5.5% for 2+ quarters
• Credit card charge-off rate exceeds 6%
• 10Y Treasury sustains above 5.25%
BASELINE → UPSIDE TRIGGERS:
• Unemployment falls below 4.0% sustainably
• Fed funds rate falls below 3.5% by end-2026
• Real GDP growth exceeds 2.5% for 3+ quarters
11. Conclusions
11.1 Summary of Key Findings
The United States lending market has demonstrated remarkable resilience and adaptability over the 2000-2025 period, successfully navigating multiple crises while undergoing fundamental structural transformation. Key conclusions include:
- Market Scale: Total credit market debt reached $79.7 trillion by Q3 2025, representing 325% growth from 2000 with 6.0% CAGR.
- Composition Shift: Government debt now comprises 46% of total credit market debt, up from ~30% in 2000, reflecting cumulative fiscal responses to economic crises.
- Credit Quality: Current household credit quality metrics remain favorable despite rate increases, with charge-off rates well below GFC peaks.
- Institutional Evolution: Non-bank lenders and fintech platforms have gained meaningful market share, altering competitive dynamics.
- Regulatory Framework: Post-GFC regulatory reforms have enhanced system resilience while constraining certain credit activities.
11.2 Strategic Implications
For market participants, the analysis suggests:
- Banks: Focus on technology investment, non-bank competition, and CRE exposure management
- Non-Bank Lenders: Navigate regulatory evolution while capitalizing on flexibility advantages
- Investors: Monitor credit cycle positioning and interest rate trajectory
- Policymakers: Balance financial stability objectives with credit access goals
11.3 Research Limitations
This analysis relies primarily on aggregate statistical releases and publicly available data. Limitations include:
- HMDA microdata analysis deferred due to file size constraints
- Call Report bank-level analysis not fully incorporated
- Fintech and BNPL market sizing based on industry estimates
- Forecast models simplified relative to full econometric approaches
12. Data Sources & Methodology
12.1 Core Data Sources
The report is primarily based on official U.S. regulatory and statistical releases. The table below summarizes the core datasets used for the key figures and conclusions.
| Source | Publisher | What It Is | Primary Use in This Report | Coverage | Update Frequency |
| FRB Z.1 | Federal Reserve | Financial Accounts of the United States | Total credit market debt and sector decomposition (household, business, government); long-cycle balance sheet context | 1945–present | Quarterly |
| FRB CHGDEL | Federal Reserve | Charge-off and Delinquency Rates | Consumer credit stress indicators; charge-off dynamics and credit quality cycle | 1985–present | Quarterly |
| FRB H.8 | Federal Reserve | Assets and Liabilities of Commercial Banks | Bank credit growth and composition; bank vs. nonbank narrative support; weekly-to-quarter alignment | 1947–present | Weekly (also used in quarterly rollups) |
| FRB SLOOS | Federal Reserve | Senior Loan Officer Opinion Survey | Lending standards and demand cycle; qualitative/quantitative overlay for tightening/easing regimes | 1990–present | Quarterly |
| FDIC Quarterly Banking Profile | FDIC | Banking industry performance and condition | Bank profitability, asset quality, and balance sheet context; cross-checking bank system trends | 1984–present | Quarterly |
| CFPB / HMDA (LAR) | CFPB / FFIEC | Mortgage originations and market structure | Mortgage origination channel mix; IMB vs. bank share and structural change in origination | Varies | Annual / Periodic |
| MBA National Delinquency Survey | MBA | Mortgage delinquency and foreclosure metrics | Mortgage credit performance proxy where official series are not sufficiently granular | Varies | Quarterly |
Notes:
- All “as-of” metrics in the Executive Summary reference the latest available release at the time of drafting, unless explicitly stated otherwise.
- For non-official datasets (e.g., private credit AUM estimates), the report labels them as industry estimates and treats them as directional rather than auditable totals.
12.2 Methodology Summary
To ensure comparability across long-cycle figures and indicators, the following standardized conventions are applied:
- Frequency Standardization: All inputs are harmonized to a quarterly frequency. Weekly series are aggregated to quarter-end aligned values; monthly series are converted to quarterly by quarter-end (or quarterly цикл averages where relevant and stated).
- Date Alignment: Quarterly time stamps are aligned to quarter-end dates for consistency across all charts.
- Growth Rates (YoY): For quarterly series, year-over-year growth is computed as
- Stock vs. Flow Treatment: Balance-sheet “stocks” (e.g., debt outstanding) are treated as quarter-end levels; “flows” (e.g., originations where used) are treated according to the source’s reporting convention, with explicit labeling in figures.
- Recession Shading: NBER recession dates are applied consistently across long-cycle charts to facilitate regime comparison.
- Scenario Forecasts: Forward scenarios are illustrative and implemented as constant compound annual growth rate (CAGR) paths calibrated to historical ranges and policy assumptions. They are not structural macro models.
- Auditability and Data Gaps: Where a metric cannot be precisely computed from official sources (e.g., certain bank vs. nonbank balance shares), the report provides qualitative framing and flags limitations explicitly; all such items are enumerated in the Auditability Notes (Appendix C).
(2) Appendices — Recommended Structure & Format (Paste-ready)
Appendix A: Data Dictionary (Key Metrics)
This appendix provides standardized definitions and source mappings for all key metrics used in the report.
Table A.1. Key Metrics Definitions and Source Mapping
| Metric | Definition | Unit | Frequency | Primary Source | Series / Table Reference |
| Total Credit Market Debt | All credit market instruments outstanding | $T | Quarterly | FRB Z.1 | L.1 (Line reference as applicable) |
| Household Debt | Total liabilities of the household sector | $T | Quarterly | FRB Z.1 | L.101 (Line reference as applicable) |
| Mortgage Debt | Home mortgages outstanding | $T | Quarterly | FRB Z.1 | L.218 (Line reference as applicable) |
| Consumer Credit | Revolving + non-revolving consumer credit | $T | Monthly | FRB G.19 | Total |
| C&I Loans (Banks) | Commercial and industrial loans at commercial banks | $T | Weekly | FRB H.8 | Line reference as applicable |
| Credit Card Charge-off Rate | Net charge-offs / average loans, annualized | % | Quarterly | FRB CHGDEL | CCSA |
| Mortgage Delinquency (30+ days) | 30+ days past due / total loans | % | Quarterly | MBA NDS | Total |
| Household Debt Service Ratio (DSR) | Debt service payments / disposable personal income | % | Quarterly | FRB (DSR release) | TDSP |
| Private Credit AUM | Assets under management of private debt funds | $T | Quarterly/Periodic | Preqin (industry estimate) | Industry estimate |
Appendix B: Source and Series Index
This appendix provides a reference index for each dataset, including access location and refresh cadence.
Table B.1. Federal Reserve Data Sources
| Code | Full Name | Frequency | Access |
| Z.1 | Financial Accounts of the United States | Quarterly | federalreserve.gov/releases/z1/ |
| G.19 | Consumer Credit | Monthly | federalreserve.gov/releases/g19/ |
| H.8 | Assets and Liabilities of Commercial Banks | Weekly | federalreserve.gov/releases/h8/ |
| H.15 | Selected Interest Rates | Daily | federalreserve.gov/releases/h15/ |
| CHGDEL | Charge-Off and Delinquency Rates | Quarterly | federalreserve.gov/releases/chargeoff/ |
| SLOOS | Senior Loan Officer Opinion Survey | Quarterly | federalreserve.gov/data/sloos.htm |
| DSR | Household Debt Service Ratio | Quarterly | federalreserve.gov/releases/housedebt/ |
Table B.2. Other Official Data Sources
| Source | Publisher | Coverage | Access |
| HMDA LAR | CFPB / FFIEC | Mortgage originations | ffiec.cfpb.gov |
| Call Reports | FFIEC | Bank financials | ffiec.gov/cdr/ |
| NBER Recessions | NBER | Business cycle dates | nber.org/cycles/ |
| CPI | BLS | Inflation | bls.gov/cpi/ |
| GDP | BEA | National accounts | bea.gov/data/gdp/ |
Table B.3. Industry Data Sources
| Source | Publisher | Coverage | Limitation |
| Private Debt Quarterly | Preqin | Private credit AUM, fundraising | Survey-based estimates; not an official regulatory total |
| Private Debt Report | PitchBook | Private credit deals, performance | Voluntary reporting; coverage varies |
| Leveraged Lending / CLO | S&P Global LCD | Leveraged loans, CLO market | Subscription dataset; methodology proprietary |
| National Delinquency Survey | MBA | Mortgage performance | Member survey; not a regulator dataset |
Appendix C: Auditability Notes and TBD Items
This appendix documents auditability constraints and any remaining gaps.
C.1 Resolved Items
- Household debt decomposition reconciled to Z.1 household sector table (line mapping documented in Appendix A).
- Credit card charge-off rate reference point validated against FRB CHGDEL latest available quarter at time of drafting.
- NBER recession shading applied consistently across long-cycle charts.
C.2 Remaining Limitations / TBD Items
- Bank vs. nonbank total balance share cannot be computed precisely from a single official dataset at the system level; the report provides qualitative framing with supporting indicators.
- Private credit AUM is sourced from industry estimates; no comprehensive official regulatory series exists for total AUM across all private credit vehicles.
- Any figures referencing the most recent quarter are bounded by release availability; where 2025Q4 data are not released, the report uses 2025Q3 (or earlier) and labels the cutoff explicitly.