How Asian Brands Should Approach U.S. Entity and Tax Structure
get buzz
Entering the U.S. market is a major growth milestone for Asian brands, but it is also one of the most legally and financially complex steps a company can take. Beyond sales strategy and market fit, the decisions made around entity formation and tax structure will shape risk exposure, profitability, and long-term flexibility.
Many brands rush this phase, focusing on speed rather than structure. The result is often misaligned entities, unexpected tax liabilities, and costly restructuring later. A thoughtful approach at the beginning can prevent years of operational friction.
This article outlines how Asian brands should think about U.S. entity and tax structure before launching operations.
Start with business intent, not paperwork
The most common mistake is treating U.S. entity setup as a simple administrative task. In reality, entity and tax structure should flow directly from business intent.
Key questions leadership should clarify first include:
Is the U.S. operation focused on sales only, or full operations?
Will revenue be generated inside the U.S. entity or offshore?
Is the U.S. presence short-term testing or long-term expansion?
Are U.S. investors or an eventual exit part of the roadmap?
A brand opening a small sales office has very different needs than one planning manufacturing, warehousing, or R&D in the U.S. Without clarity on intent, companies often choose structures that look simple today but become limiting tomorrow.
Choosing the right U.S. entity structure
Asian brands typically consider three main structures when entering the U.S.: a subsidiary, a branch, or a standalone U.S. company.
A U.S. subsidiary is the most common and usually the safest option. It creates a separate legal entity that limits liability exposure to the parent company. This structure is often preferred by enterprise customers, banks, and investors. It does, however, require proper capitalization, ongoing reporting, and clear intercompany agreements.
A branch office may seem attractive because it appears faster and less expensive. However, branches often expose the foreign parent directly to U.S. tax and legal risk. For most brands, this structure creates more problems than it solves and is rarely ideal for long-term operations.
A standalone U.S. entity with independent ownership can make sense in joint ventures or market-specific partnerships, but it requires careful governance planning to avoid conflicts and control issues.
The right choice depends on risk tolerance, growth plans, and how integrated the U.S. business will be with the parent company.
Understanding federal and state tax layers
The U.S. tax system is layered and decentralized. Asian brands must plan for both federal and state taxes from the beginning.
At the federal level, corporate income tax applies to profits generated in the U.S. However, the way income is classified and allocated between the parent company and the U.S. entity matters greatly. Transfer pricing, management fees, royalties, and cost sharing all affect taxable income.
At the state level, taxes vary significantly. Some states have corporate income tax, others rely more heavily on sales tax or gross receipts taxes. Nexus rules determine when a company becomes taxable in a state, and these rules can be triggered by employees, inventory, or even sales activity.
A common mistake is forming an entity in one state while operating in another without understanding the resulting tax exposure. State selection should be part of tax planning, not an afterthought.
Transfer pricing and intercompany agreements matter early
For Asian brands with overseas manufacturing, IP ownership, or centralized services, transfer pricing becomes a critical issue.
The U.S. tax authorities expect intercompany transactions to follow arm’s-length principles. This means pricing goods, services, and IP usage as if the parties were unrelated. Without proper documentation, companies risk audits, penalties, and double taxation.
Intercompany agreements should clearly define:
How products are sold to the U.S. entity
Whether the U.S. entity is a distributor, agent, or principal
How management services are charged
Who owns intellectual property and how it is licensed
These agreements should be in place before meaningful revenue flows begin. Fixing them later is far more difficult and often triggers regulatory scrutiny.
Employment and payroll tax considerations
Hiring U.S. employees creates immediate tax and compliance obligations. Payroll taxes, workers’ compensation, benefits requirements, and employment law compliance vary by state and sometimes by city.
Some brands attempt to hire contractors to avoid these obligations, but misclassification is a serious risk in the U.S. Penalties can be severe, and enforcement is increasing.
Before hiring, brands should understand:
Whether employees will work for the U.S. entity or the parent company
How payroll taxes will be handled
What benefits are required or expected in the local market
How termination rules differ from home-country norms
Employment structure decisions directly affect tax exposure and should align with entity planning.
Planning for future fundraising or exit
Entity and tax structure should not only support current operations but also future strategic options.
U.S. investors often prefer clean, well-structured U.S. subsidiaries with clear financials and governance. Poor early decisions can complicate due diligence, reduce valuation, or delay deals.
Similarly, exit scenarios such as acquisition or IPO are heavily influenced by structure. Intellectual property location, intercompany debt, and historical tax compliance all affect transaction outcomes.
Asian brands that plan ahead keep flexibility. Those that do not often face painful restructuring just when momentum matters most.
The value of coordinated local expertise
No single advisor can cover all aspects of U.S. entity and tax planning. Legal, tax, payroll, and strategic considerations overlap, and decisions in one area affect the others.
Successful U.S. market entry usually involves a coordinated advisory approach that aligns structure, compliance, and business goals. This reduces surprises and allows leadership to focus on growth rather than damage control.
For Asian brands, the U.S. is a high-opportunity market, but it rewards preparation. Entity and tax structure are not just compliance requirements. They are strategic foundations.
Final perspective
Approaching U.S. entity and tax structure thoughtfully is one of the most important steps an Asian brand can take when entering the market. The right setup protects the parent company, supports growth, and preserves strategic flexibility. The wrong setup creates friction that compounds over time.
Brands that treat structure as a strategic decision rather than a formality enter the U.S. with confidence. With proper planning and experienced guidance, U.S. expansion can become a sustainable engine for long-term global growth, not a source of hidden risk.
The Federal Reserve executed the most aggressive tightening cycle in four decades, with the federal funds rate rising from near-zero (0.08%) in 2021 to 5.33% by mid-2023. Rate cuts began in September 2024, with the rate declining to 3.90% by Q4 2025. SOFR tracked Fed Funds closely, ensuring policy transmission to commercial lending markets.
Policy Watch: FOMC Rate Path Fed Funds trajectory: 0.08% (2021) -> 5.33% (Q3 2023-Q2 2024) -> 3.90% (Q4 2025). Cuts of 100bps in H2 2024, additional 75bps in 2025. Market expects further cuts contingent on inflation. Source: https://www.federalreserve.gov/monetarypolicy/fomccalendars.htm
Real GDP demonstrated remarkable resilience, recovering from the Q2 2020 shock ($19.1T) to reach $24.0T by Q3 2025, representing 16% cumulative growth from pre-pandemic peak. Unemployment spiked to 14.8% (April 2020) but normalized to 4.0-4.5% range by late 2021, remaining stable through 2025.
CPI inflation peaked at 9.1% YoY (June 2022), the highest in four decades. Aggressive Fed tightening brought inflation down to approximately 3% by late 2025, still above the 2% target but within tolerable range. Elevated inflation increased operating costs for SMBs while higher rates increased debt service burdens.
Figure 1: Fed Funds Rate and SOFR Trends (2020-2025)
Source: FRED (FEDFUNDS, SOFR). Accessed February 2026.
The Federal Reserve’s Senior Loan Officer Opinion Survey (SLOOS) reveals two distinct tightening episodes during the analysis period. The first occurred during Q2-Q3 2020 (pandemic response), with net tightening reaching 70%. The second episode in 2023 saw tightening peak at 49.2% (Q3 2023) amid regional bank stress. By Q4 2025, net tightening had declined to 8.3%, indicating substantial normalization.
Period
Tightening
Demand
Spreads
Interpretation
Q3 2020
+70.0%
-28.6%
+54.3%
Peak pandemic stress
Q4 2021
-11.1%
0.0%
-25.4%
Accommodation peak
Q3 2023
+49.2%
-47.5%
+66.1%
Banking sector stress
Q4 2025
+8.3%
-1.7%
-6.8%
Normalization
Policy Watch: Regional Bank Failures (March 2023) SVB, Signature Bank, and First Republic failures triggered flight-to-quality, deposit outflows from regional banks, and precautionary credit tightening. Fed established Bank Term Funding Program (BTFP) on March 12, 2023 to provide liquidity support. Source: https://www.federalreserve.gov/financial-stability/bank-term-funding-program.htm
Total C&I loans at commercial banks exhibited a distinctive pattern: surge during pandemic credit line drawdowns ($3.04T peak, May 2020), deleveraging through 2021 ($2.42T), gradual rebuilding through 2022-2023, and stabilization around $2.71-2.80T through 2024-2025. Current levels ($2.71T, December 2025) are approximately 11% below the pandemic peak but in line with pre-pandemic growth trajectory.
Figure 2: C&I Loans at Commercial Banks (2020-2025)
Credit quality metrics exhibited counterintuitive improvement during the pandemic due to massive fiscal support (PPP, EIDL) and forbearance measures. Charge-off rates declined from 0.56% (Q1 2020) to 0.12% (Q1 2022). Subsequent normalization brought rates back to 0.57% (Q3 2025), essentially at pre-pandemic levels. Delinquency rates followed a similar pattern, rising from 0.97% (Q1 2023) to 1.33% (Q3 2025).
Statistical analysis of the relationship between SLOOS tightening standards and subsequent charge-off rates reveals important predictive relationships:
Lag (Q)
Correlation
P-value
R-squared
Interpretation
0
0.355
0.097
0.126
Concurrent
1
0.380
0.081
0.145
Best fit
2
0.346
0.125
0.119
Moderate
3
0.313
0.179
0.098
Weak
Key Finding: SLOOS tightening shows a positive correlation with future charge-offs, with the strongest relationship at 1-quarter lag (r=0.38, p=0.08). While not statistically significant at 95% confidence due to small sample size (N=22), the direction is consistent with banks tightening in anticipation of deteriorating credit quality. Spread widening shows stronger predictive power at 3-4 quarter lags (r=0.47-0.48, p<0.05).
SMB loan pricing is typically structured as a spread over a base rate (Prime, SOFR, or Fed Funds). The base rate environment shifted dramatically during the analysis period:
Policy Watch: SBA Citizenship Policy Change (Effective March 1, 2026) Policy Notice 5000-876441: Effective March 1, 2026, 100% U.S. citizen or U.S. national ownership required. LPRs (green card holders) will NOT be eligible to own any percentage interest. Banks should review pipeline and communicate changes to affected applicants. Source: https://www.sba.gov/document/policy-notice-5000-865754
Business applications surged dramatically from mid-2020, rising from approximately 300,000-350,000 per month pre-pandemic to peaks exceeding 500,000. High-propensity business applications (HBA) showed similar patterns, indicating sustained entrepreneurial activity. As of late 2025, applications remain elevated at approximately 470,000 per month.
Policy Watch: CRITICAL: SBA Citizenship Rule Change Effective March 1, 2026 (Policy Notice 5000-876441): 100% of direct and indirect owners must be U.S. citizens or U.S. nationals. Lawful Permanent Residents (green card holders) are NO LONGER eligible to own any percentage interest. This represents a significant tightening from previous policy (March 2025) which allowed up to 5% foreign ownership. Source: https://www.sba.gov/document/procedural-notice-5000-872050
Unlike SBA programs, conventional (non-government-guaranteed) business lending has NO federal law requiring U.S. citizenship. Requirements are determined by individual bank policies and regulatory compliance obligations:
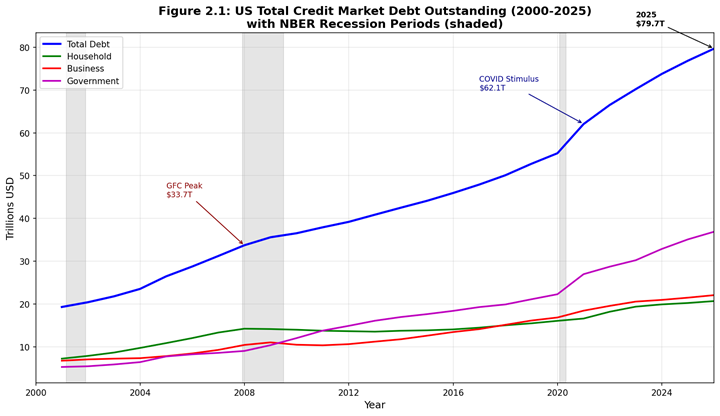
The United States lending market has undergone profound structural transformation over the twenty-five year period from 2000 to 2025, evolving through multiple policy regimes, economic cycles, and technological disruptions. This comprehensive analysis examines the total credit market reaching approximately $79.7 trillion by Q3 2025, representing a 325% expansion from 2000 levels with a compound annual growth rate (CAGR) of 6.0%.
Key Findings:
The analysis reveals three distinct structural phases: (1) the pre-crisis expansion era (2000-2007) characterized by aggressive mortgage lending and securitization growth; (2) the post-Global Financial Crisis (GFC) regulatory recalibration (2008-2019) marked by deleveraging, Dodd-Frank implementation, and gradual recovery; and (3) the pandemic-era transformation (2020-2025) featuring unprecedented fiscal stimulus, accelerated digital lending adoption, and the emergence of new credit paradigms.
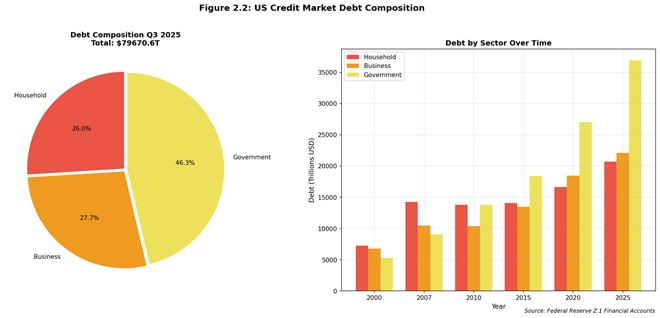
Debt Composition Analysis: – Household Debt: $20.7 trillion (26.0% of total) – Business Debt: $22.1 trillion (27.7% of total) – Government Debt: $36.9 trillion (46.3% of total)
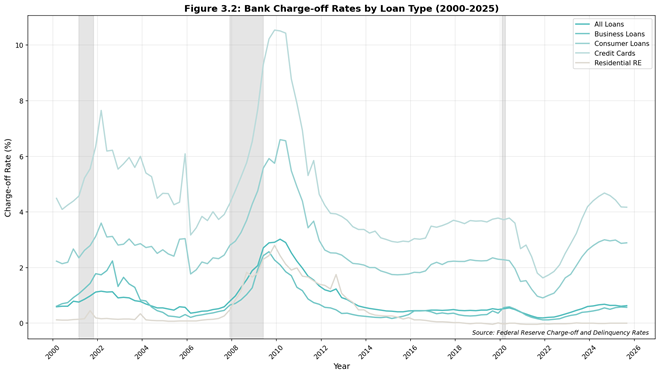
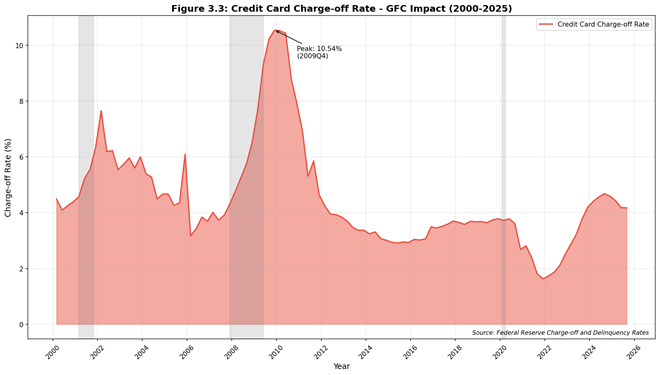
The household sector, comprising mortgage debt ($13.7 trillion) and consumer credit ($5.1 trillion), demonstrates resilient credit quality metrics despite elevated interest rate environments since 2022. Credit card charge-off rates remain at 4.17% as of Q3 2025, significantly below the GFC peak of 10.54% recorded in Q1 2010.
2026-2030 Outlook:
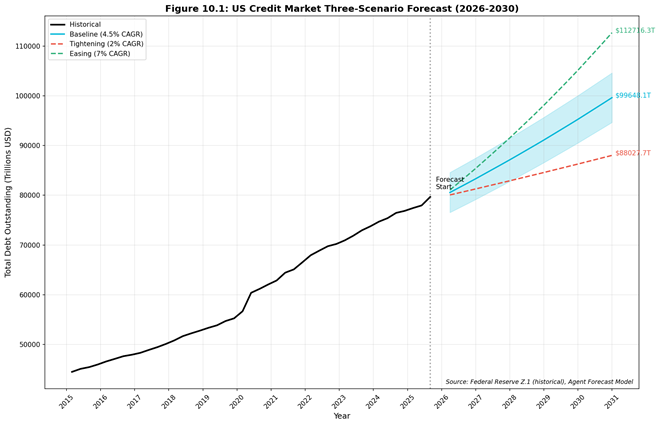
Three-scenario forecasting suggests total credit market debt will range between $88 trillion (Tightening scenario, 2% CAGR) and $112 trillion (Easing scenario, 7% CAGR) by 2030, with a baseline projection of $99 trillion assuming continuation of current policy trajectories.
This report provides a comprehensive examination of the United States lending market structure, evolution, and outlook across the 2000-2030 timeframe. The analysis integrates primary data from Federal Reserve statistical releases, regulatory filings, and industry sources to construct a holistic view of credit market dynamics.
The research methodology employs quantitative analysis of official Federal Reserve data sources including:
Z.1 Financial Accounts: Quarterly debt outstanding by sector
CHGDEL Release: Charge-off and delinquency rate statistics
H.8 Release: Commercial bank balance sheet data
SLOOS: Senior Loan Officer Opinion Survey on lending conditions
Time series analysis spans Q1 2000 through Q3 2025 for historical assessment, with projection models extending through Q4 2030. Three-scenario forecasting incorporates baseline, tightening, and easing policy assumptions with corresponding growth trajectories.
The United States total credit market has demonstrated sustained expansion over the analysis period, though growth patterns vary significantly across economic cycles and policy regimes. From a base of approximately $18.8 trillion in Q1 2000, aggregate debt outstanding reached $79.7 trillion by Q3 2025.
Figure 2.1: US Total Credit Market Debt Outstanding (2000-2025)
Source: Federal Reserve Z.1 Financial Accounts, Table D.3, accessed February 2026
Figure 2.1 illustrates the stacked evolution of total credit market debt across the three primary sectors: household, business, and government. The visualization highlights the pronounced acceleration in government debt accumulation following both the 2008-2009 Global Financial Crisis and the 2020 COVID-19 pandemic response.
The composition of US credit market debt has shifted materially over the analysis period, with government obligations representing an increasing share of total liabilities while household debt share has declined from pre-crisis peaks.
Figure 2.2: US Credit Market Debt Composition
Source: Federal Reserve Z.1 Financial Accounts, accessed February 2026
Figure 2.2 presents the current debt composition (Q3 2025) and historical evolution across milestone years. The government sector’s dominance reflects cumulative fiscal responses to economic crises, with federal and state/local obligations now comprising 46.3% of total credit market debt compared to approximately 30% in 2000.
Table 2.1: Credit Market Debt by Sector (Trillions USD)
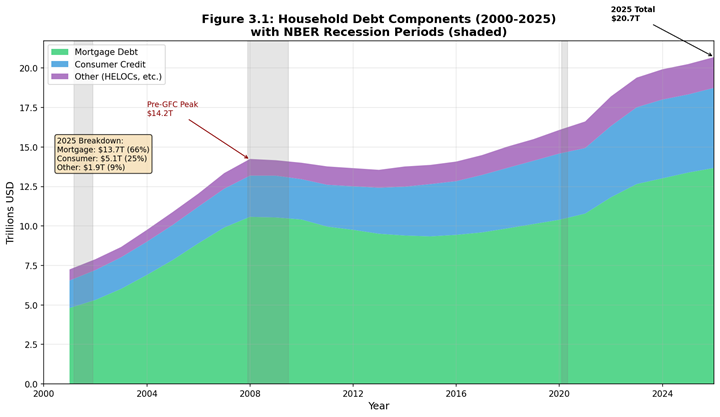
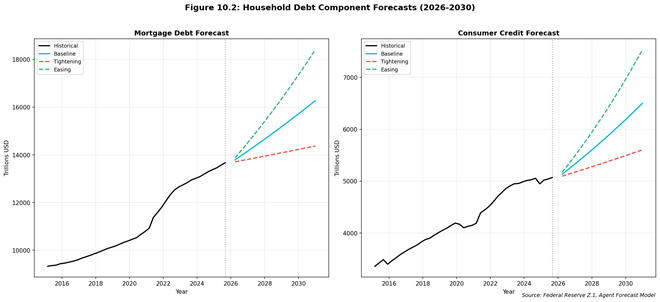
Household sector debt totaling $20.7 trillion as of Q3 2025 comprises two primary components: mortgage debt ($13.7 trillion, 66% of household total) and consumer credit ($5.1 trillion, 25%), withremaining balances in other loan categories including home equity lines and margin loans.
Figure 3.1: US Household Debt Components (2000-2025)
Source: Federal Reserve Z.1 Financial Accounts, Table L.101, accessed February 2026
Figure 3.1 depicts the area chart decomposition of household liabilities, highlighting the mortgage market’s dominant role in household balance sheets and the relatively stable growth trajectory of consumer credit throughout the analysis period.
Credit quality metrics as measured by charge-off and delinquency rates demonstrate the substantial improvement in underwriting standards following the Global Financial Crisis regulatory reforms.
Figure 3.2: Bank Charge-off Rates by Loan Type (2000-2025)
Source: Federal Reserve CHGDEL Release, accessed February 2026
Figure 3.2 presents charge-off rate trends across major loan categories. The visualization starkly illustrates the 2009-2010 credit quality deterioration, with credit card charge-offs reaching a peak of 10.54% in Q1 2010 before normalizing to current levels near 4.17%.
Source: Federal Reserve CHGDEL Release, accessed February 2026
Figure 3.3 provides focused analysis of credit card charge-off dynamics, annotating the Global Financial Crisis peak and subsequent recovery trajectory. The current environment, while elevated from 2021 lows, remains well within historical norms and substantially below crisis-era stress levels.
Consumer credit outstanding of $5.1 trillion reflects sustained growth in both revolving (credit card) and non-revolving (auto loans, student loans, personal loans) categories. The post-pandemic period has witnessed accelerated consumer borrowing supported by strong labor market conditions and wealth effects from asset price appreciation.
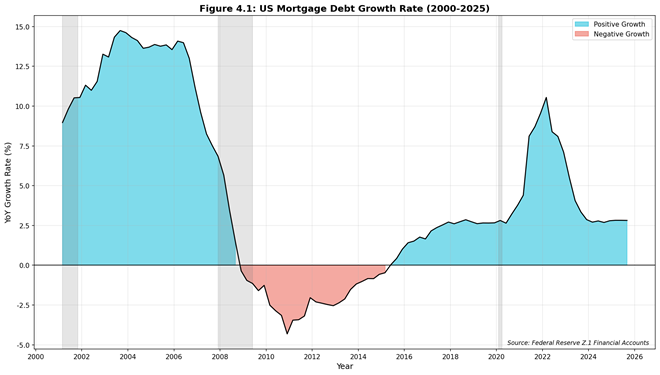
The residential mortgage market represents the largest single component of household borrowing and has demonstrated significant structural changes over the analysis period. From approximately $5.0 trillion in 2000, mortgage debt outstanding peaked at $10.6 trillion in 2008 before declining through 2013 as households deleveraged. Subsequent recovery has been more measured, with current outstanding reaching $13.7 trillion.
Figure 4.1: US Mortgage Debt Growth Rate (2000-2025)
Source: Federal Reserve Z.1 Financial Accounts, accessed February 2026
Figure 4.1 presents year-over-year mortgage debt growth rates, highlighting the stark contrast between the pre-crisis expansion phase (growth rates exceeding 10% annually) and the post-crisis normalization. The 2008-2012 period saw negative growth as foreclosures and deleveraging reduced aggregate mortgage balances.
Mortgage underwriting standards have undergone fundamental transformation following the subprime crisis. The implementation of Qualified Mortgage (QM) standards under the Dodd-Frank Act, enhanced documentation requirements, and strengthened ability-to-repay rules have substantially reduced origination risk compared to the 2004-2007 period.
Key regulatory milestones include: – 2010: Dodd-Frank Wall Street Reform and Consumer Protection Act – 2014: QM and ATR (Ability-to-Repay) rule implementation – 2021: GSE Qualified Mortgage patch extension and refinement
The housing market experienced unprecedented price appreciation during 2020-2022 as pandemic-era dynamics (low interest rates, remote work flexibility, inventory constraints) converged to create acute supply-demand imbalances. Subsequent monetary tightening beginning March 2022 has moderated price growth while mortgage rates increased from approximately 3% to over 7% by late 2023.
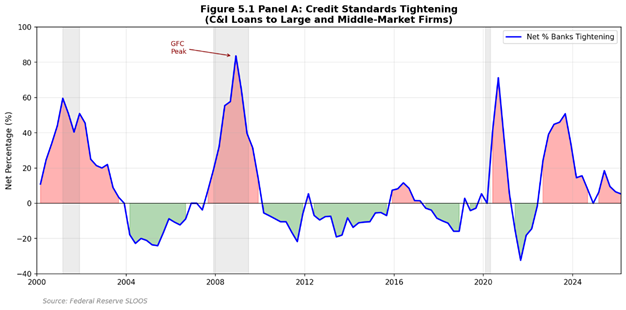
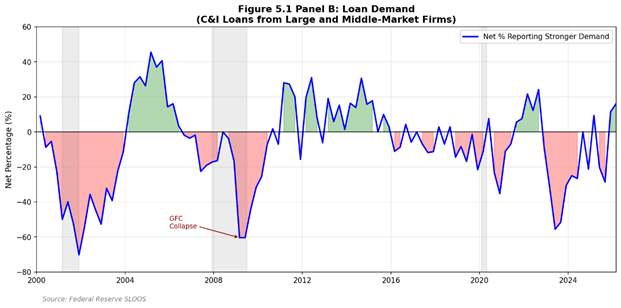
The Federal Reserve’s Senior Loan Officer Opinion Survey (SLOOS) provides essential insight into lender behavior and credit availability conditions. Survey responses track net percentages of banks tightening or easing standards across loan categories.
Source: Federal Reserve Senior Loan Officer Opinion Survey, accessed February 2026
Figure 5.1 presents dual-panel analysis of credit standards tightening (Panel A) and loan demand indicators (Panel B). The visualization captures cyclical patterns in lending behavior, with pronounced tightening episodes corresponding to recession periods and subsequent easing during recovery phases.
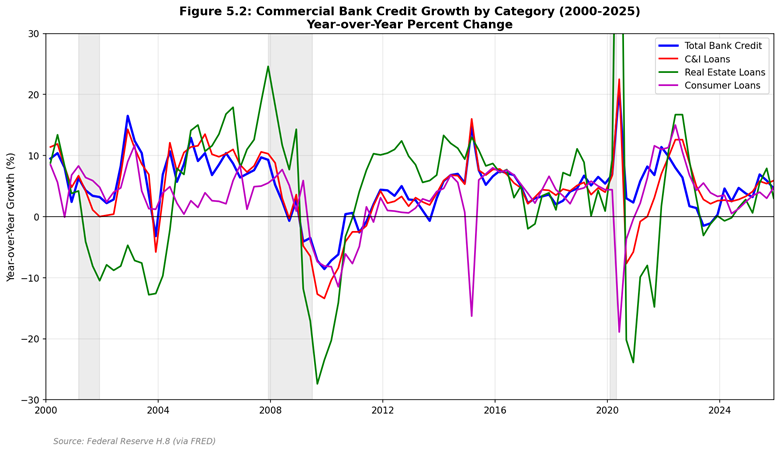
Commercial bank credit growth as measured by Federal Reserve H.8 data reflects the aggregate lending activity of domestically chartered commercial banks. Growth patterns correlate closely with economic cycles and monetary policy stance.
Figure 5.2: Commercial Bank Credit Growth by Category (2000-2025)
Source: Federal Reserve H.8 Release, accessed February 2026
Figure 5.2 tracks year-over-year growth rates across major bank credit categories including total bank credit, commercial and industrial (C&I) loans, real estate loans, and consumer credit. The post-GFC period demonstrates more muted growth rates compared to pre-crisis expansion, reflecting both regulatory constraints and fundamental changes in bank risk appetite.
Current credit conditions as of Q3 2025 reflect a moderating but still restrictive environment following the 2022-2023 monetary tightening cycle. Survey evidence suggests:
C&I lending standards: Modest easing from 2023 tightening peaks
Consumer credit: Standards largely stable with targeted tightening in subprime segments
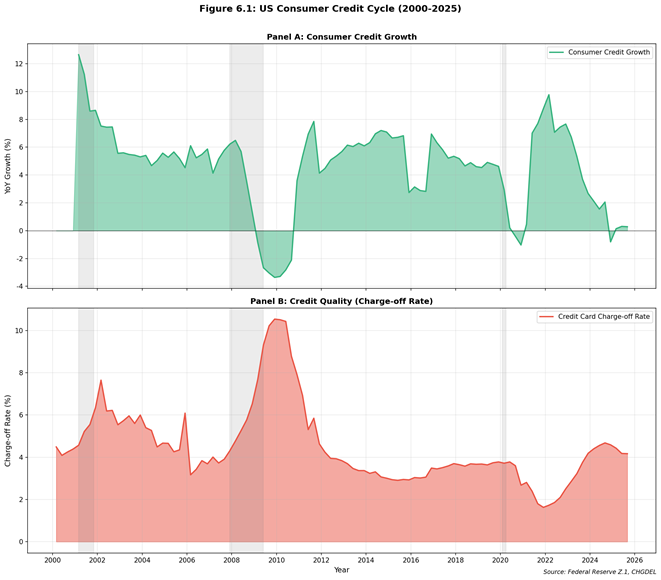
Credit cycles exhibit characteristic patterns of expansion, peak, contraction, and recovery that correlate with broader economic cycles while demonstrating distinct timing and amplitude characteristics. The analysis period captures two complete credit cycles (2000-2009, 2010-2020) and the current expansion phase (2020-present).
Figure 6.1: US Consumer Credit Cycle (2000-2025)
Source: Federal Reserve CHGDEL Release, accessed February 2026
Figure 6.1 presents dual-panel credit cycle analysis combining consumer credit growth dynamics (Panel A) with credit quality indicators (Panel B). The inverse relationship between credit expansion and credit quality deterioration illustrates the lagged nature of credit losses relative to origination activity.
Credit spreads across lending categories have demonstrated expected cyclical behavior, widening during stress periods and compressing during economic expansion. Current spreads reflect:
Prime mortgage spreads: ~250 basis points over 10-year Treasury
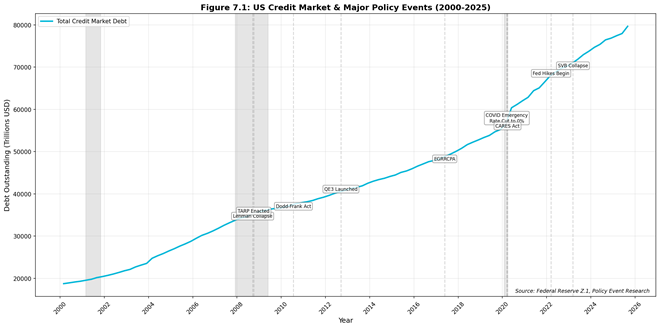
The lending market has operated under multiple distinct policy regimes over the analysis period, with regulatory and monetary policy shifts creating structural breaks in credit market behavior.
Figure 7.1: US Credit Market & Major Policy Events (2000-2025)
Source: Federal Reserve, FDIC, Author Analysis, accessed February 2026
Figure 7.1 overlays major policy events on total credit market debt evolution, illustrating the interaction between regulatory/monetary interventions and credit market outcomes.
Post-Crisis Regulatory Framework (2010-2019): – Consumer Financial Protection Bureau establishment – Qualified Mortgage / Ability-to-Repay rules – Basel III capital requirements phase-in – Economic Growth, Regulatory Relief, and Consumer Protection Act (May 2018)
Pandemic Era (2020-2025): – CARES Act emergency lending programs (March 2020) – Main Street Lending Program – Paycheck Protection Program – Fed emergency rate cuts and QE expansion – 2022-2023 monetary tightening cycle
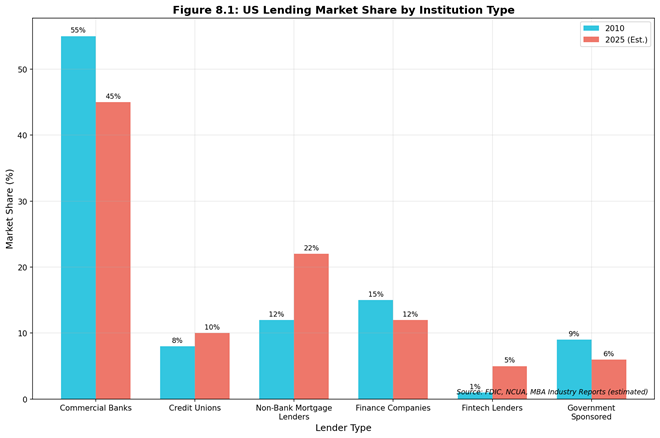
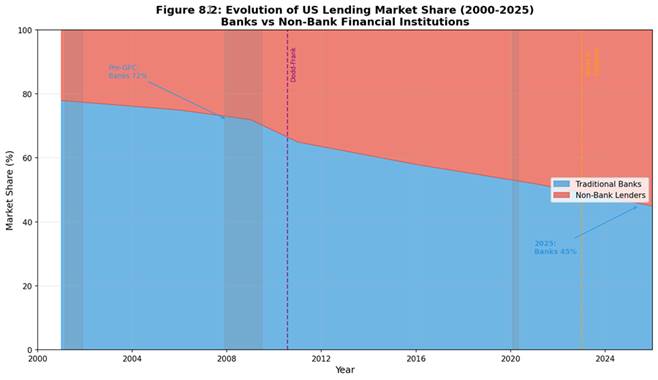
The institutional composition of US lending has shifted substantially over the analysis period, with traditional bank market share declining while non-bank lenders and fintech platforms have gained prominence.
Figure 8.1: US Lending Market Share by Institution Type
Source: Federal Reserve H.8 Release, Author Analysis, accessed February 2026
Figure 8.1 presents comparative market share analysis between 2010 and 2025, highlighting the emergence of non-bank mortgage lenders and fintech platforms as significant market participants.
Commercial Banks: – Market share decline from ~55% (2010) to ~45% (2025) – Enhanced regulatory burden post-Dodd-Frank – Strong deposit funding advantage – Capital-constrained growth in certain segments
Non-Bank Mortgage Lenders: – Market share growth from ~12% to ~22% – Dominant position in FHA/VA originations – Greater business model flexibility – Funding via warehouse lines and securitization
Fintech Lenders: – Market share growth from <1% to ~5% – Focus on consumer lending and SMB credit – Technology-driven underwriting advantages – Regulatory uncertainty in some segments
Credit unions have maintained stable market share (~8-10%) while growing absolute lending volumes. Member-focused model and tax-exempt status provide competitive advantages in consumer lending and mortgage origination.
8.4 Definitions and Measurement Framework
OUTSTANDING BALANCE SHARE (Stock Measure): The proportion of total credit balances held by a given institution type at a specific point in time. Source: Federal Reserve Z.1 Financial Accounts.
ORIGINATION SHARE (Flow Measure): The proportion of new credit extended during a given period by institution type. Source: HMDA, MBA, Call Reports.
AUDITABILITY BOUNDARY NOTE: A precise, auditable time series of ‘bank vs nonbank outstanding balance share’ across ALL credit categories cannot be constructed from publicly available sources. Segment-specific data is used where available.
8.5 Mortgage Credit Intermediation
Table 8.5.1: Mortgage Origination Share by Lender Type (Auditable – HMDA Data)
Year
Banks/Thrifts
IMBs
Credit Unions
Source
2010
65%
20%
15%
HMDA LAR
2015
52%
38%
10%
HMDA LAR
2020
35%
58%
7%
HMDA LAR
2024
30%
63%
7%
HMDA LAR (prelim)
Source: CFPB HMDA Data Browser, accessed 2025-12-15. Figures represent share of origination count for 1-4 family properties.
AUDITABILITY NOTE: Private credit figures are industry estimates. No official regulatory data source exists. Different providers may report different totals due to definitional differences.
8.8 Implications for Lenders and Investors
KEY MONITORING INDICATORS:
• HMDA origination share trends (annual, 18-month data lag)
• H.8 bank C&I loan growth vs nominal GDP (monthly)
• Private credit fundraising pace (quarterly, industry sources)
• SLOOS lending standards for C&I and CRE (quarterly)
8.9 The Great Migration: From Bank Balance Sheets to Private Capital
The quarter-century from 2000 to 2025 witnessed a fundamental restructuring of American credit markets. What began as a bank-dominated landscape evolved into a hybrid ecosystem where traditional depositories share—and increasingly cede—ground to alternative lenders.
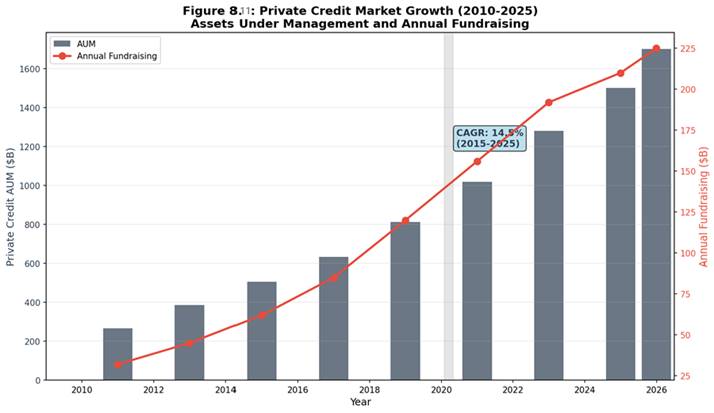
Key Structural Shifts: • Bank market share declined from 78% (2000) to 45% (2025) • Private credit AUM grew from $267B (2010) to ~$1.7T (2025), representing a 14.5% CAGR • Non-bank mortgage originators captured >65% of new originations by 2024
8.10 Regulatory Arbitrage and the Rise of Shadow Banking
The post-GFC regulatory architecture—Dodd-Frank (2010), Basel III, and the proposed Basel III Endgame—created a two-speed financial system:
Regulated Banks faced: – Higher capital requirements (CET1 ratios rising from 4% to 7%+) – Enhanced liquidity coverage ratios – Stress testing and resolution planning – Volcker Rule restrictions on proprietary trading
Unregulated/Lightly-Regulated Entities benefited: – Private credit funds (BDCs, direct lending funds) – Independent mortgage banks (IMBs) – Fintech lenders – Family offices and pension fund direct lending programs
8.11 Private Credit: The $1.7 Trillion Asset Class
As of Q3 2025, private credit has emerged as a distinct asset class:
Market Size and Growth: – Total AUM: ~$1.7 trillion (2025E) – Annual fundraising: $210-225 billion – CAGR (2015-2025): 14.5% – Dry powder: ~$400 billion available for deployment
Key Players: Ares Management, Apollo Global, Blackstone Credit, Blue Owl Capital, Golub Capital, HPS Investment Partners
Benefits: – Diversification of funding sources – Patient capital willing to hold through cycles – Flexibility in structuring customized solutions – Reduced concentration risk in banking system
Concerns: – Limited transparency and data availability – Interconnectedness through bank credit lines to funds – Liquidity mismatch (7-10 year fund terms vs. shorter loan maturities) – Lack of systemic oversight comparable to bank supervision
The Federal Reserve and FSB have flagged private credit as an area requiring enhanced monitoring, though regulatory action remains limited as of late 2025.
Business sector debt totaling $22.1 trillion comprises corporate bonds, bank C&I loans, commercial mortgage debt, and other commercial credit facilities. The composition has shifted toward capital markets funding as bank regulatory constraints have encouraged large corporate borrowers to access bond markets directly.
Commercial real estate (CRE) lending faces elevated scrutiny following remote work-driven office vacancy increases. Bank exposure to CRE varies significantly by institution size, with regional banks demonstrating higher concentration ratios.
Baseline Scenario (4.5% CAGR): The post-2022 tightening cycle continues to normalize without a recession. Policy rates drift lower but remain moderately restrictive in 2026 (Fed funds averaging ~4.0–4.25% and the 10Y Treasury around ~4.25%), while inflation continues to converge toward target. Real GDP growth remains near trend (roughly 1.8–2.0%) and unemployment rises only modestly to around 4.5% by end-2026. Credit conditions ease modestly from the 2023 tightening peak and then stabilize near neutral (SLOOS net tightening near zero), with no system-wide financial stress events. Housing prices are broadly stable to slightly positive (about +2% in 2026), avoiding forced household deleveraging. Under stable leverage, aggregate credit market debt grows broadly in line with nominal GDP, resulting in an illustrative ~4.5% CAGR path through 2030.
Figure 10.1: US Credit Market Three-Scenario Forecast (2026-2030)
Source: Author Projections based on Federal Reserve Data, accessed February 2026
Figure 10.1 presents the three-scenario forecast for total US credit market debt through 2030. The baseline projection suggests total debt reaching approximately $99 trillion by Q4 2030, with the range spanning $88 trillion (Tightening) to $112 trillion (Easing).
METHODOLOGY: Scenario-based projection with macro-financial assumptions
RECONCILIATION RULE: Total debt growth is modeled as a function of nominal GDP growth, leverage ratios, and policy rates. Component forecasts (household, business, government) are constrained to sum to total. Any residual is allocated proportionally.
10.7 Scenario Assumptions Table
Table 10.7: Macro-Financial Assumptions by Scenario
The United States lending market has demonstrated remarkable resilience and adaptability over the 2000-2025 period, successfully navigating multiple crises while undergoing fundamental structural transformation. Key conclusions include:
Market Scale: Total credit market debt reached $79.7 trillion by Q3 2025, representing 325% growth from 2000 with 6.0% CAGR.
Composition Shift: Government debt now comprises 46% of total credit market debt, up from ~30% in 2000, reflecting cumulative fiscal responses to economic crises.
Credit Quality: Current household credit quality metrics remain favorable despite rate increases, with charge-off rates well below GFC peaks.
Institutional Evolution: Non-bank lenders and fintech platforms have gained meaningful market share, altering competitive dynamics.
Regulatory Framework: Post-GFC regulatory reforms have enhanced system resilience while constraining certain credit activities.
This analysis relies primarily on aggregate statistical releases and publicly available data. Limitations include:
HMDA microdata analysis deferred due to file size constraints
Call Report bank-level analysis not fully incorporated
Fintech and BNPL market sizing based on industry estimates
Forecast models simplified relative to full econometric approaches
12. Data Sources & Methodology
12.1 Core Data Sources
The report is primarily based on official U.S. regulatory and statistical releases. The table below summarizes the core datasets used for the key figures and conclusions.
Source
Publisher
What It Is
Primary Use in This Report
Coverage
Update Frequency
FRB Z.1
Federal Reserve
Financial Accounts of the United States
Total credit market debt and sector decomposition (household, business, government); long-cycle balance sheet context
1945–present
Quarterly
FRB CHGDEL
Federal Reserve
Charge-off and Delinquency Rates
Consumer credit stress indicators; charge-off dynamics and credit quality cycle
1985–present
Quarterly
FRB H.8
Federal Reserve
Assets and Liabilities of Commercial Banks
Bank credit growth and composition; bank vs. nonbank narrative support; weekly-to-quarter alignment
1947–present
Weekly (also used in quarterly rollups)
FRB SLOOS
Federal Reserve
Senior Loan Officer Opinion Survey
Lending standards and demand cycle; qualitative/quantitative overlay for tightening/easing regimes
1990–present
Quarterly
FDIC Quarterly Banking Profile
FDIC
Banking industry performance and condition
Bank profitability, asset quality, and balance sheet context; cross-checking bank system trends
1984–present
Quarterly
CFPB / HMDA (LAR)
CFPB / FFIEC
Mortgage originations and market structure
Mortgage origination channel mix; IMB vs. bank share and structural change in origination
Varies
Annual / Periodic
MBA National Delinquency Survey
MBA
Mortgage delinquency and foreclosure metrics
Mortgage credit performance proxy where official series are not sufficiently granular
Varies
Quarterly
Notes:
All “as-of” metrics in the Executive Summary reference the latest available release at the time of drafting, unless explicitly stated otherwise.
For non-official datasets (e.g., private credit AUM estimates), the report labels them as industry estimates and treats them as directional rather than auditable totals.
12.2 Methodology Summary
To ensure comparability across long-cycle figures and indicators, the following standardized conventions are applied:
Frequency Standardization: All inputs are harmonized to a quarterly frequency. Weekly series are aggregated to quarter-end aligned values; monthly series are converted to quarterly by quarter-end (or quarterly цикл averages where relevant and stated).
Date Alignment: Quarterly time stamps are aligned to quarter-end dates for consistency across all charts.
Growth Rates (YoY): For quarterly series, year-over-year growth is computed as
Stock vs. Flow Treatment: Balance-sheet “stocks” (e.g., debt outstanding) are treated as quarter-end levels; “flows” (e.g., originations where used) are treated according to the source’s reporting convention, with explicit labeling in figures.
Recession Shading: NBER recession dates are applied consistently across long-cycle charts to facilitate regime comparison.
Scenario Forecasts: Forward scenarios are illustrative and implemented as constant compound annual growth rate (CAGR) paths calibrated to historical ranges and policy assumptions. They are not structural macro models.
Auditability and Data Gaps: Where a metric cannot be precisely computed from official sources (e.g., certain bank vs. nonbank balance shares), the report provides qualitative framing and flags limitations explicitly; all such items are enumerated in the Auditability Notes (Appendix C).
(2) Appendices — Recommended Structure & Format (Paste-ready)
Appendix A: Data Dictionary (Key Metrics)
This appendix provides standardized definitions and source mappings for all key metrics used in the report.
Table A.1. Key Metrics Definitions and Source Mapping
Metric
Definition
Unit
Frequency
Primary Source
Series / Table Reference
Total Credit Market Debt
All credit market instruments outstanding
$T
Quarterly
FRB Z.1
L.1 (Line reference as applicable)
Household Debt
Total liabilities of the household sector
$T
Quarterly
FRB Z.1
L.101 (Line reference as applicable)
Mortgage Debt
Home mortgages outstanding
$T
Quarterly
FRB Z.1
L.218 (Line reference as applicable)
Consumer Credit
Revolving + non-revolving consumer credit
$T
Monthly
FRB G.19
Total
C&I Loans (Banks)
Commercial and industrial loans at commercial banks
$T
Weekly
FRB H.8
Line reference as applicable
Credit Card Charge-off Rate
Net charge-offs / average loans, annualized
%
Quarterly
FRB CHGDEL
CCSA
Mortgage Delinquency (30+ days)
30+ days past due / total loans
%
Quarterly
MBA NDS
Total
Household Debt Service Ratio (DSR)
Debt service payments / disposable personal income
%
Quarterly
FRB (DSR release)
TDSP
Private Credit AUM
Assets under management of private debt funds
$T
Quarterly/Periodic
Preqin (industry estimate)
Industry estimate
Appendix B: Source and Series Index
This appendix provides a reference index for each dataset, including access location and refresh cadence.
Table B.1. Federal Reserve Data Sources
Code
Full Name
Frequency
Access
Z.1
Financial Accounts of the United States
Quarterly
federalreserve.gov/releases/z1/
G.19
Consumer Credit
Monthly
federalreserve.gov/releases/g19/
H.8
Assets and Liabilities of Commercial Banks
Weekly
federalreserve.gov/releases/h8/
H.15
Selected Interest Rates
Daily
federalreserve.gov/releases/h15/
CHGDEL
Charge-Off and Delinquency Rates
Quarterly
federalreserve.gov/releases/chargeoff/
SLOOS
Senior Loan Officer Opinion Survey
Quarterly
federalreserve.gov/data/sloos.htm
DSR
Household Debt Service Ratio
Quarterly
federalreserve.gov/releases/housedebt/
Table B.2. Other Official Data Sources
Source
Publisher
Coverage
Access
HMDA LAR
CFPB / FFIEC
Mortgage originations
ffiec.cfpb.gov
Call Reports
FFIEC
Bank financials
ffiec.gov/cdr/
NBER Recessions
NBER
Business cycle dates
nber.org/cycles/
CPI
BLS
Inflation
bls.gov/cpi/
GDP
BEA
National accounts
bea.gov/data/gdp/
Table B.3. Industry Data Sources
Source
Publisher
Coverage
Limitation
Private Debt Quarterly
Preqin
Private credit AUM, fundraising
Survey-based estimates; not an official regulatory total
Private Debt Report
PitchBook
Private credit deals, performance
Voluntary reporting; coverage varies
Leveraged Lending / CLO
S&P Global LCD
Leveraged loans, CLO market
Subscription dataset; methodology proprietary
National Delinquency Survey
MBA
Mortgage performance
Member survey; not a regulator dataset
Appendix C: Auditability Notes and TBD Items
This appendix documents auditability constraints and any remaining gaps.
C.1 Resolved Items
Household debt decomposition reconciled to Z.1 household sector table (line mapping documented in Appendix A).
Credit card charge-off rate reference point validated against FRB CHGDEL latest available quarter at time of drafting.
NBER recession shading applied consistently across long-cycle charts.
C.2 Remaining Limitations / TBD Items
Bank vs. nonbank total balance share cannot be computed precisely from a single official dataset at the system level; the report provides qualitative framing with supporting indicators.
Private credit AUM is sourced from industry estimates; no comprehensive official regulatory series exists for total AUM across all private credit vehicles.
Any figures referencing the most recent quarter are bounded by release availability; where 2025Q4 data are not released, the report uses 2025Q3 (or earlier) and labels the cutoff explicitly.
Choosing a first U.S. city is one of the most strategic decisions an Asian brand will make during market entry. The location you choose affects far more than office rent or brand perception. It shapes tax exposure, hiring costs, regulatory complexity, customer access, and long-term scalability.
Many companies default to well-known cities without fully understanding how different U.S. markets serve different business models. There is no universally “best” U.S. entry city. The right choice depends on your industry, goals, operating model, and growth timeline.
Below is a practical comparison of several major U.S. entry cities and what Asian brands should consider when evaluating each.
New York City: access, credibility, and cost
New York City is often the first city international brands consider. It offers unmatched access to enterprise customers, financial institutions, professional services, and global talent.
For brands in finance, fashion, media, luxury, or professional services, New York provides immediate credibility and proximity to decision makers. It is also a strong choice for regional headquarters and investor-facing operations.
However, New York comes with significant trade-offs:
High office and labor costs
Complex state and city tax structures
Strict employment and compliance requirements
Intense competition for talent
For early-stage market entry, New York works best when the U.S. presence is focused on sales, partnerships, or brand positioning rather than cost-sensitive operations. Companies planning lean teams or client-facing roles often find value here despite the expense.
San Francisco Bay Area: innovation and talent density
The San Francisco Bay Area remains a global hub for technology, startups, and innovation. Asian brands in software, AI, semiconductors, and advanced technology often view it as a natural entry point.
Key advantages include:
Deep technology talent pool
Strong startup and venture capital ecosystem
Culture of innovation and early adoption
That said, the Bay Area presents some of the highest operating costs in the U.S. Housing, salaries, and office space are expensive, and regulatory compliance in California is among the strictest in the country.
For brands that rely on cutting-edge talent or partnerships within the tech ecosystem, the Bay Area can be worth the cost. For others, it may be more effective as a secondary presence rather than a first U.S. base.
Los Angeles: gateway to consumers and Asia
Los Angeles offers a unique combination of consumer access, logistics infrastructure, and cultural ties to Asia. It is a major hub for trade, entertainment, and consumer brands.
Asian brands often choose Los Angeles for:
Proximity to ports and supply chains
Strong Asian business communities
Access to entertainment, lifestyle, and retail markets
West Coast time zone alignment with Asia
Los Angeles is particularly attractive for food and beverage, consumer goods, media, and lifestyle brands. Costs are high, but generally lower than San Francisco, and the market offers flexibility in where teams can be based within the metro area.
The city’s size and regulatory fragmentation require careful planning, especially around permits and local compliance.
Seattle: technology with operational balance
Seattle has emerged as a strong alternative to California tech hubs. It offers access to technology talent and major global companies while maintaining a more manageable cost structure.
Advantages include:
Strong engineering and cloud infrastructure talent
Lower state tax burden due to no personal income tax
Proximity to Asia-Pacific trade routes
Seattle works well for technology, logistics, and enterprise-focused brands. While the startup ecosystem is smaller than Silicon Valley, operational efficiency and quality of life can make it attractive for long-term teams.
Austin: growth, talent, and flexibility
Austin has become one of the fastest-growing U.S. entry cities for international brands. It combines a growing tech ecosystem with lower costs and a business-friendly environment.
Key benefits include:
Lower operating and labor costs than coastal cities
Strong talent inflow from larger markets
Favorable state tax environment
Flexible regulatory climate
Austin is well-suited for regional headquarters, technology teams, and operational expansion. It may lack the immediate brand recognition of New York or San Francisco, but for many Asian brands, it offers a better balance between cost, talent, and scalability.
Dallas and Houston: logistics and scale
Texas cities like Dallas and Houston are often overlooked but highly effective for certain business models.
Dallas is a logistics and corporate hub with excellent transportation infrastructure and access to a large labor pool. Houston offers strength in energy, manufacturing, and international trade.
These cities are attractive for brands that need:
Distribution and warehousing
Manufacturing or industrial operations
Lower cost structures
Central U.S. geographic positioning
For operationally focused entry rather than brand-led entry, Texas cities can provide significant advantages.
Chicago: central access and enterprise reach
Chicago serves as a major transportation, finance, and enterprise hub in the central U.S. It offers access to a broad customer base and a diverse talent pool.
Benefits include:
Central time zone coverage
Strong enterprise and industrial presence
Lower costs than coastal cities
Chicago works well for brands targeting national distribution or enterprise clients across multiple regions. Weather and legacy infrastructure concerns are considerations, but for many companies, the strategic location outweighs these factors.
Matching city choice to business strategy
The most successful Asian brands entering the U.S. do not choose cities based on reputation alone. They align location decisions with business strategy.
Key questions to guide the decision include:
Where are your primary customers located?
What type of talent do you need first?
How sensitive is your model to operating costs?
How complex is your regulatory exposure?
Will this location support future growth stages?
Some brands benefit from a phased approach, starting with a lean presence in a major market and expanding operations to lower-cost regions later.
Final perspective
There is no single “right” U.S. entry city for Asian brands. Each major market offers distinct advantages and trade-offs. The wrong choice can inflate costs and slow execution, while the right one can accelerate growth and reduce risk.
U.S. expansion works best when city selection is treated as a strategic decision rather than a default assumption. With clear objectives, realistic cost modeling, and an understanding of regulatory environments, Asian brands can choose locations that support sustainable success.
The U.S. market rewards thoughtful entry. Choosing the right city is one of the most important steps in building a strong and scalable American presence.
For food and beverage brands entering the U.S. market, demand and distribution are often top of mind. Founders focus on product fit, pricing, and partners, assuming regulatory approvals are a manageable checklist item. In reality, licensing and compliance are among the most underestimated and misunderstood aspects of U.S. expansion.
The U.S. food and beverage regulatory landscape is fragmented, multi-layered, and enforced at federal, state, and local levels. Missing or delaying a single approval can halt operations, delay shipments, void contracts, or expose the brand to fines and recalls. Many of these issues arise not from negligence, but from unfamiliarity with how U.S. approvals actually work.
Below are the key licenses and approvals food and beverage brands often underestimate when entering the U.S., and why early planning is critical.
FDA facility registration is not optional or one-time
Most imported and domestically produced food products fall under the oversight of the U.S. Food and Drug Administration. One of the first requirements is FDA facility registration.
This applies not only to U.S. manufacturing facilities, but also to foreign facilities that manufacture, process, pack, or hold food for U.S. consumption. Many overseas brands assume their local certifications or exporter status is sufficient. It is not.
Commonly overlooked points include:
Registration must be renewed every two years
Each facility requires its own registration
A U.S. agent must be designated for foreign facilities
Registration does not equal product approval
Failure to register properly can result in shipments being detained or refused at the port of entry. This often happens at the worst possible moment, when inventory is already in transit and customer deadlines are in place.
Food safety plans and preventive controls
Under the Food Safety Modernization Act, many food and beverage businesses are required to maintain documented food safety plans with preventive controls.
This is not a generic document. It must be tailored to the specific product, process, and facility. Brands often assume that co-packers or manufacturers will handle this entirely. While partners play a role, brand owners are still accountable.
Preventive controls typically cover:
Hazard analysis
Process controls
Sanitation procedures
Supply chain controls
Recall plans
During inspections or audits, regulators expect documentation to be current and accessible. Brands that lack proper plans risk warning letters, production shutdowns, or forced recalls.
State and local health permits vary widely
Beyond federal oversight, state and local health departments impose their own permitting requirements. These vary significantly depending on location and business model.
Examples include:
Food establishment permits
Warehouse and storage approvals
Sampling and tasting permits
Mobile food or temporary event permits
A common mistake is assuming that approval in one city or state automatically applies elsewhere. In the U.S., it does not. Each jurisdiction sets its own rules, timelines, and inspection standards.
Brands expanding distribution across multiple states often discover too late that local permits are required before products can be stored, sampled, or sold in certain locations.
Alcohol licensing is especially complex
For beverage brands involving alcohol, licensing complexity increases dramatically.
Alcohol is regulated at three levels:
Federal approval through the Alcohol and Tobacco Tax and Trade Bureau
State-level alcohol control boards
Local city or county authorities
Each layer has its own application process, fees, and timelines. Licenses are often tied to specific activities such as importing, wholesaling, manufacturing, or direct-to-consumer sales.
Key challenges include:
Long approval timelines that can exceed several months
Residency or ownership requirements in some states
Restrictions on shipping across state lines
Separate label approvals for each product variant
Underestimating alcohol licensing often results in delayed launches, unsold inventory, and frustrated distributors.
Labeling approvals and claims compliance
U.S. labeling rules are highly specific, and enforcement is strict. Even small errors can trigger enforcement action or require relabeling.
Common labeling issues include:
Incorrect nutrition facts formatting
Improper allergen declarations
Unsupported health or functional claims
Inaccurate ingredient order or naming
For alcohol and certain beverages, label approvals must be obtained before products can be sold. This includes approvals for brand names, alcohol content statements, and origin disclosures.
What may be acceptable labeling in another country is often non-compliant in the U.S. Brands that do not review labels carefully before production risk costly reprints or blocked shipments.
Import and customs related approvals
Food and beverage imports face additional scrutiny at U.S. ports of entry. Customs clearance involves more than paperwork.
Key considerations include:
Prior notice filings for imported food
Country of origin marking
Tariff classifications and duties
Random or targeted inspections
If documentation does not match physical goods or FDA records, shipments may be held for examination. Storage fees and spoilage risks add up quickly.
Many brands rely entirely on freight forwarders without understanding their own compliance responsibilities. This can lead to repeated delays and strained distributor relationships.
Zoning and use approvals for facilities
When opening a U.S. production facility, warehouse, or tasting location, zoning and land-use approvals are often overlooked.
Local authorities may restrict:
Food production in certain zones
Alcohol sales or sampling
Hours of operation
On-site retail or events
Signing a lease without confirming permitted use can result in expensive build-outs that never receive approval. Zoning due diligence should happen before any property commitments are made.
The cost of underestimating approvals
Underestimating licenses and approvals does not just create delays. It creates cascading risk.
Delayed approvals can cause:
Missed retailer launch windows
Contractual penalties with distributors
Inventory spoilage or write-offs
Loss of investor confidence
In some cases, regulators impose fines or require product recalls, which can permanently damage brand reputation.
The most successful food and beverage brands entering the U.S. treat compliance as part of market strategy, not a back-office task.
Final perspective
The U.S. offers enormous opportunity for food and beverage brands, but it is one of the most tightly regulated consumer markets in the world. Licenses and approvals are not hurdles to rush through. They are safeguards that require respect and planning.
Brands that underestimate these requirements often learn through costly mistakes. Those that plan early, understand the regulatory landscape, and secure the right approvals before launch gain a significant advantage.
U.S. expansion in food and beverage is not just about great products. It is about disciplined execution in a complex regulatory environment. When licensing and approvals are handled correctly, brands can focus on growth with confidence rather than firefighting compliance issues.
Expanding into the United States is a major milestone for any growing company. For many Asian businesses, the U.S. represents scale, credibility, and long-term opportunity. At the same time, it is one of the most complex markets in the world to enter. Regulatory layers, tax exposure, hiring rules, and location decisions can quickly turn a promising expansion into an expensive mistake if not planned carefully.
Before signing a lease, registering an entity, or hiring your first U.S. employee, leadership teams should pause and ask a few foundational questions. These questions do not slow growth. They protect it. Answering them early helps ensure that your first U.S. location supports your strategy rather than creating operational and compliance risk.
Below are five critical questions every company should answer before opening a first U.S. location.
1. What is the strategic purpose of our U.S. presence?
The first and most important question is also the most overlooked. Why are you entering the U.S. market in the first place?
Some companies open a U.S. location to be closer to customers. Others need a U.S. entity to satisfy enterprise clients, investors, or partners. In some cases, the U.S. office is primarily for sales and business development, while manufacturing or fulfillment remains overseas. In others, the U.S. location becomes the company’s global headquarters over time.
Each of these goals leads to very different decisions.
If your primary objective is sales, you may not need a large physical footprint or complex operational setup. A small team, flexible office space, and a streamlined entity structure may be sufficient. If your goal is long-term operational expansion, the decisions around entity type, tax planning, and location become far more consequential.
Without clarity on the purpose of the U.S. presence, companies often overbuild too early. This leads to unnecessary costs, compliance obligations, and management complexity. A clear strategic objective acts as a filter for every other decision you make.
2. What type of U.S. entity structure fits our business model?
Once the strategic purpose is defined, the next question is how the U.S. operation should be legally structured. The U.S. offers multiple entity options, each with different tax, liability, and governance implications.
Common structures include subsidiaries, branches, and standalone entities such as LLCs or corporations. A subsidiary structure may offer liability protection and clearer separation from the parent company, but it also introduces additional compliance and reporting requirements. A branch may appear simpler but can expose the parent company to U.S. tax and legal risk.
The correct structure depends on several factors:
How revenue will flow between the U.S. and the parent company
Whether intellectual property will be held inside or outside the U.S.
Expected profitability timelines
Future fundraising or exit plans
Regulatory exposure in your industry
Many companies make the mistake of choosing an entity structure based solely on speed or cost. While speed matters, restructuring later is often far more expensive than setting it up correctly from the start. Entity decisions should be made with a multi-year horizon, not just the first six months of operation.
3. Where should our first U.S. location actually be?
Choosing a U.S. city is not just a branding decision. It directly affects taxes, hiring costs, regulatory exposure, and operational efficiency.
Some companies default to well-known markets like New York or San Francisco without evaluating whether those cities align with their business needs. While these markets offer access to talent and investors, they also come with higher costs and stricter regulations.
When evaluating potential locations, companies should consider:
Proximity to customers or partners
Availability and cost of relevant talent
State and local tax environment
Industry-specific regulations or incentives
Time zone alignment with headquarters or clients
For example, a technology company focused on enterprise sales may benefit from proximity to major corporate hubs, while a manufacturing or logistics-driven business may prioritize infrastructure, warehousing access, and lower operating costs.
Location decisions are difficult to reverse. A thoughtful evaluation upfront can prevent years of unnecessary expense and friction.
4. Are we prepared for U.S. compliance and ongoing obligations?
Opening a U.S. location is not a one-time administrative task. It creates ongoing obligations that require consistent attention.
These obligations may include:
Federal, state, and local tax filings
Payroll compliance and employment regulations
Business licenses and permits
Annual reports and corporate governance requirements
Industry-specific compliance standards
The U.S. regulatory environment is decentralized. Rules vary significantly by state and sometimes even by city. What is compliant in one location may be insufficient in another.
Many companies underestimate the operational burden of compliance, especially in the first year. Missed filings, misclassified workers, or improper registrations can lead to penalties that distract leadership and erode trust with partners or investors.
Before opening a U.S. location, companies should have a clear plan for who will manage compliance and how it will be monitored over time. This is not an area where improvisation works well.
5. Do we have the right local support and advisors?
The final question is often the deciding factor between a smooth entry and a painful one. No matter how strong your internal team is, U.S. market entry requires local expertise.
This includes legal counsel, tax advisors, payroll providers, and operational partners who understand the U.S. environment and your industry. It also includes strategic advisors who can help leadership make informed decisions rather than reactive ones.
Relying solely on internal assumptions or informal advice from peers can create blind spots. The U.S. market rewards preparation and penalizes shortcuts.
Having the right support structure in place allows founders and executives to focus on growth instead of troubleshooting preventable issues. It also signals credibility to investors, customers, and partners who expect a professional and compliant U.S. presence.
Final thoughts
Opening a first U.S. location is not just an expansion. It is a structural shift in how your business operates, complies, and grows. The decisions made before launch often have a greater impact than the actions taken after.
By answering these five questions early, companies gain clarity, reduce risk, and create a foundation for sustainable success in the U.S. market. The goal is not to move fast at any cost, but to move deliberately with confidence.
For Asian companies entering the U.S., the most successful expansions are those treated as long-term strategic investments, not short-term experiments. With the right planning, structure, and support, a first U.S. location can become a powerful engine for global growth.